Fig. 2.
Download original image
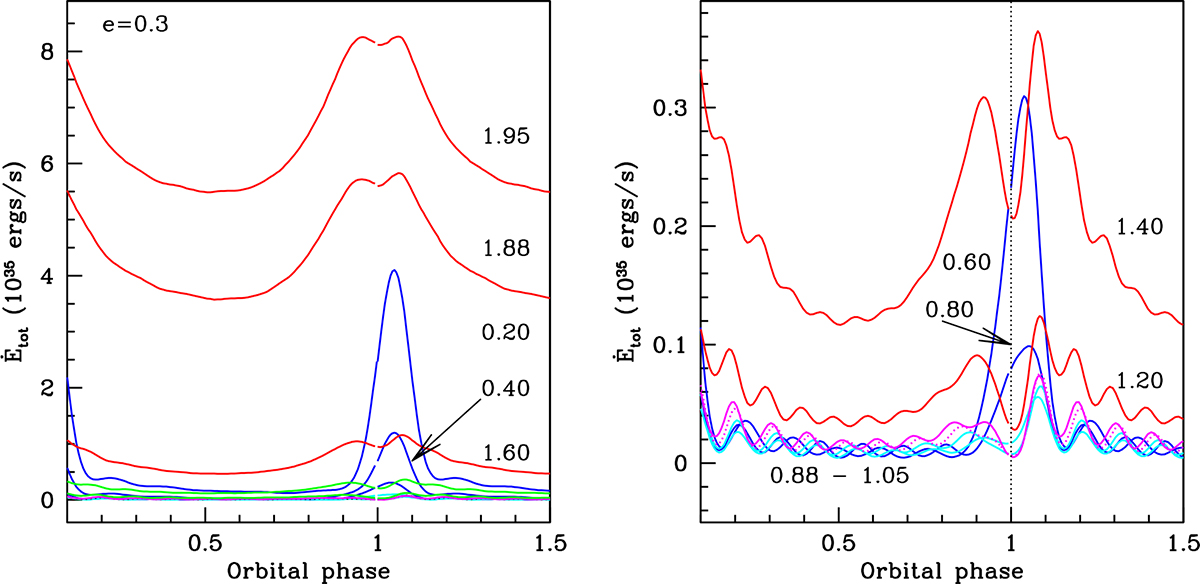
Total energy dissipation rate (in units of 1035 ergs s−1) as a function of the orbital phase for the e = 0.3 set of models. Models with β0 < 0.80 (blue) show a relatively narrow periastron effect with a single peak centered in phase slightly after periastron passage. Models with β0 ≥ 1.20 show a significantly broader periastron effect with a structured peak. Models with 1.20 ≤ β0 > 0.80 tend to have a dominant peak after periastron and multiple weaker peaks at other phases. Left: all models of the set. Right: models with 0.60 ≥ β0 ≤ 1.40, which have the weakest energy dissipation rates and are plotted on a scale that shows the variations associated with the tidally excited oscillations.
Current usage metrics show cumulative count of Article Views (full-text article views including HTML views, PDF and ePub downloads, according to the available data) and Abstracts Views on Vision4Press platform.
Data correspond to usage on the plateform after 2015. The current usage metrics is available 48-96 hours after online publication and is updated daily on week days.
Initial download of the metrics may take a while.