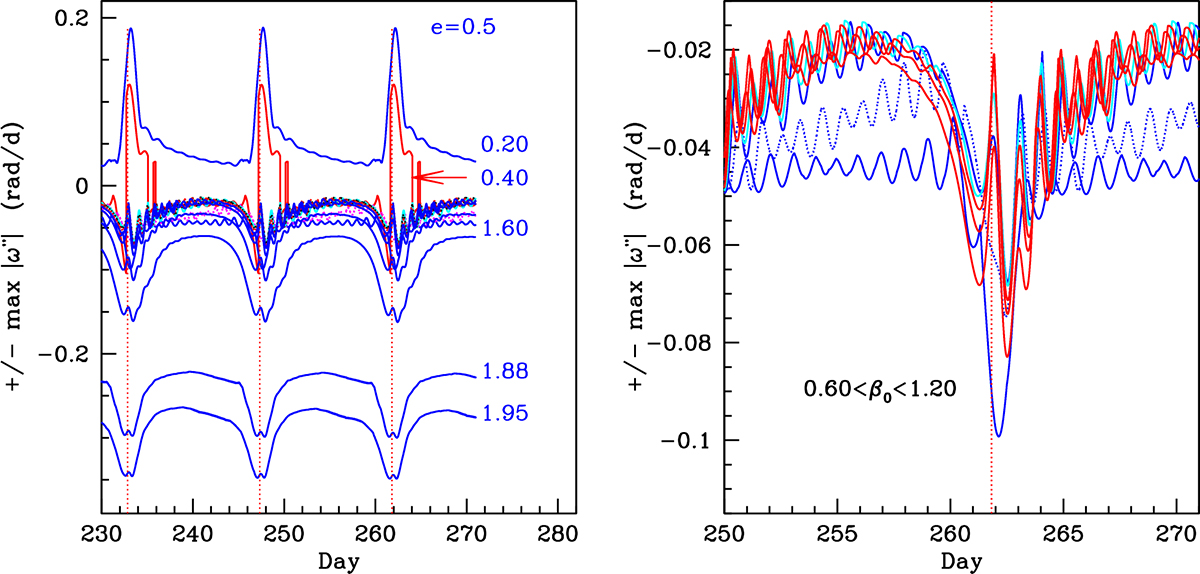
Fig. A.2.
Download original image
Maximum perturbation of the surface angular velocity at the equator for e=0.5 plotted as a function of time. The velocity is measured in the reference frame at rest in the rotating star. Positive values indicate motion in the direction of the orbital motion, negative values motion opposite to the orbital motion. Vertical lines indicate times of periastron. Left: All models with β0 increasing from top to bottom. Models close to pseudosynchronism are not labeled for clarity in the figure. Right: Models with 0.60≤β0≤1.00 are plotted in blue and cyan and those with 1.05≤β0≤1.20 in red.
Current usage metrics show cumulative count of Article Views (full-text article views including HTML views, PDF and ePub downloads, according to the available data) and Abstracts Views on Vision4Press platform.
Data correspond to usage on the plateform after 2015. The current usage metrics is available 48-96 hours after online publication and is updated daily on week days.
Initial download of the metrics may take a while.