Fig. 9.
Download original image
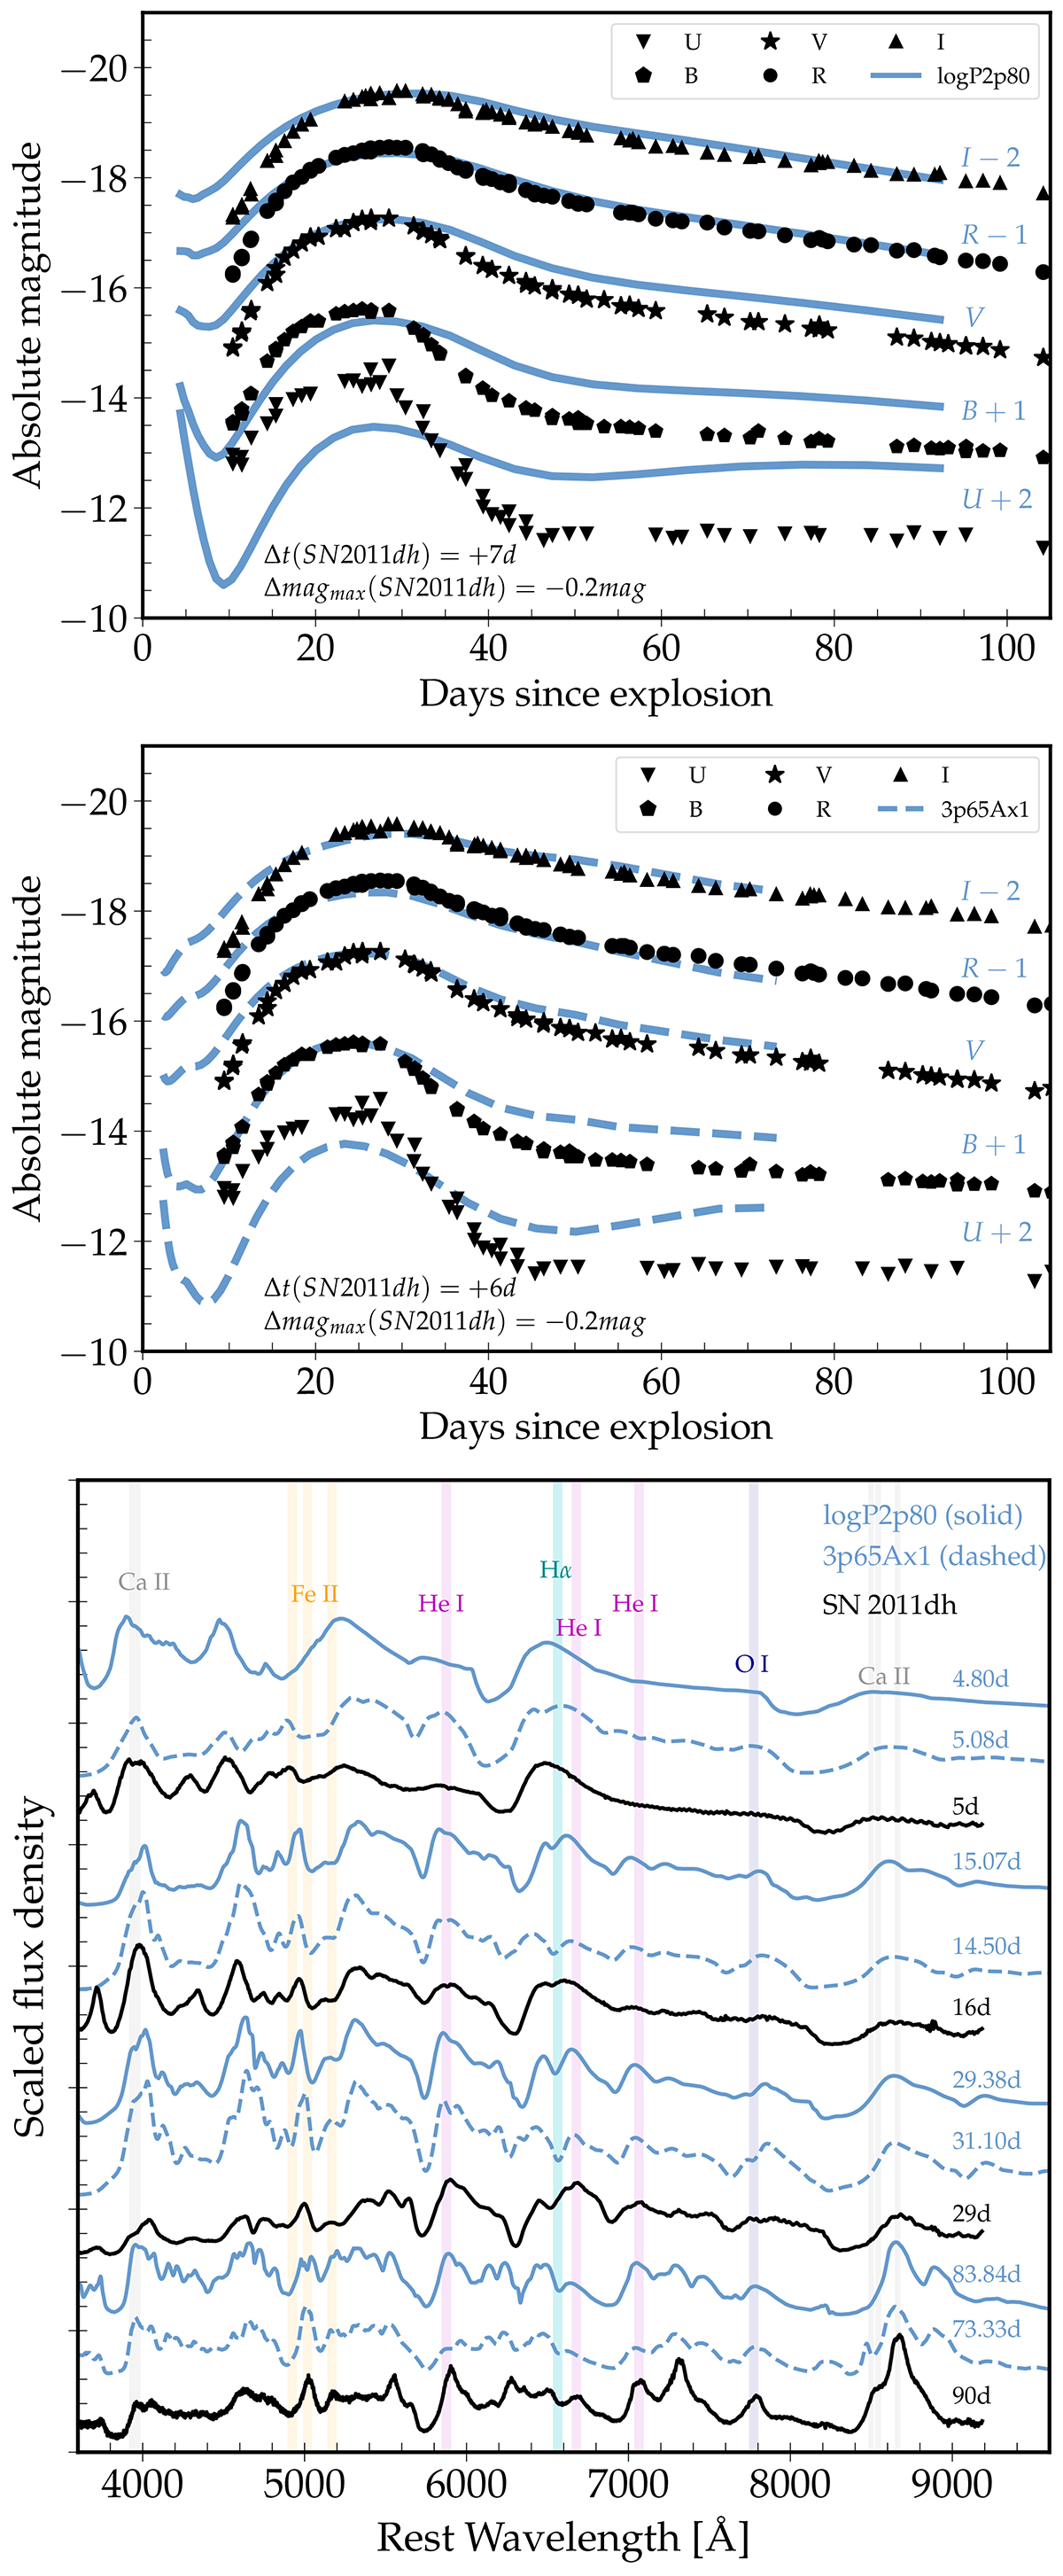
Comparison of model light curves and spectra with the observations of SN 2011dh. Top: photometric data (black symbols) shifted in time by +7 d and in magnitude by −0.2 mag as well as the results for model logP2p80 (solid line). Middle: same as top but for the model 3p65Ax1 of Dessart et al. (2015), now with a shift in time of +6 d. Bottom: Comparison of multi-epoch spectra at about 5, 15, 30, and 85 d after explosion for SN 2011dh and models logP2p80 and 3p65Ax1.
Current usage metrics show cumulative count of Article Views (full-text article views including HTML views, PDF and ePub downloads, according to the available data) and Abstracts Views on Vision4Press platform.
Data correspond to usage on the plateform after 2015. The current usage metrics is available 48-96 hours after online publication and is updated daily on week days.
Initial download of the metrics may take a while.