Fig. 5.
Download original image
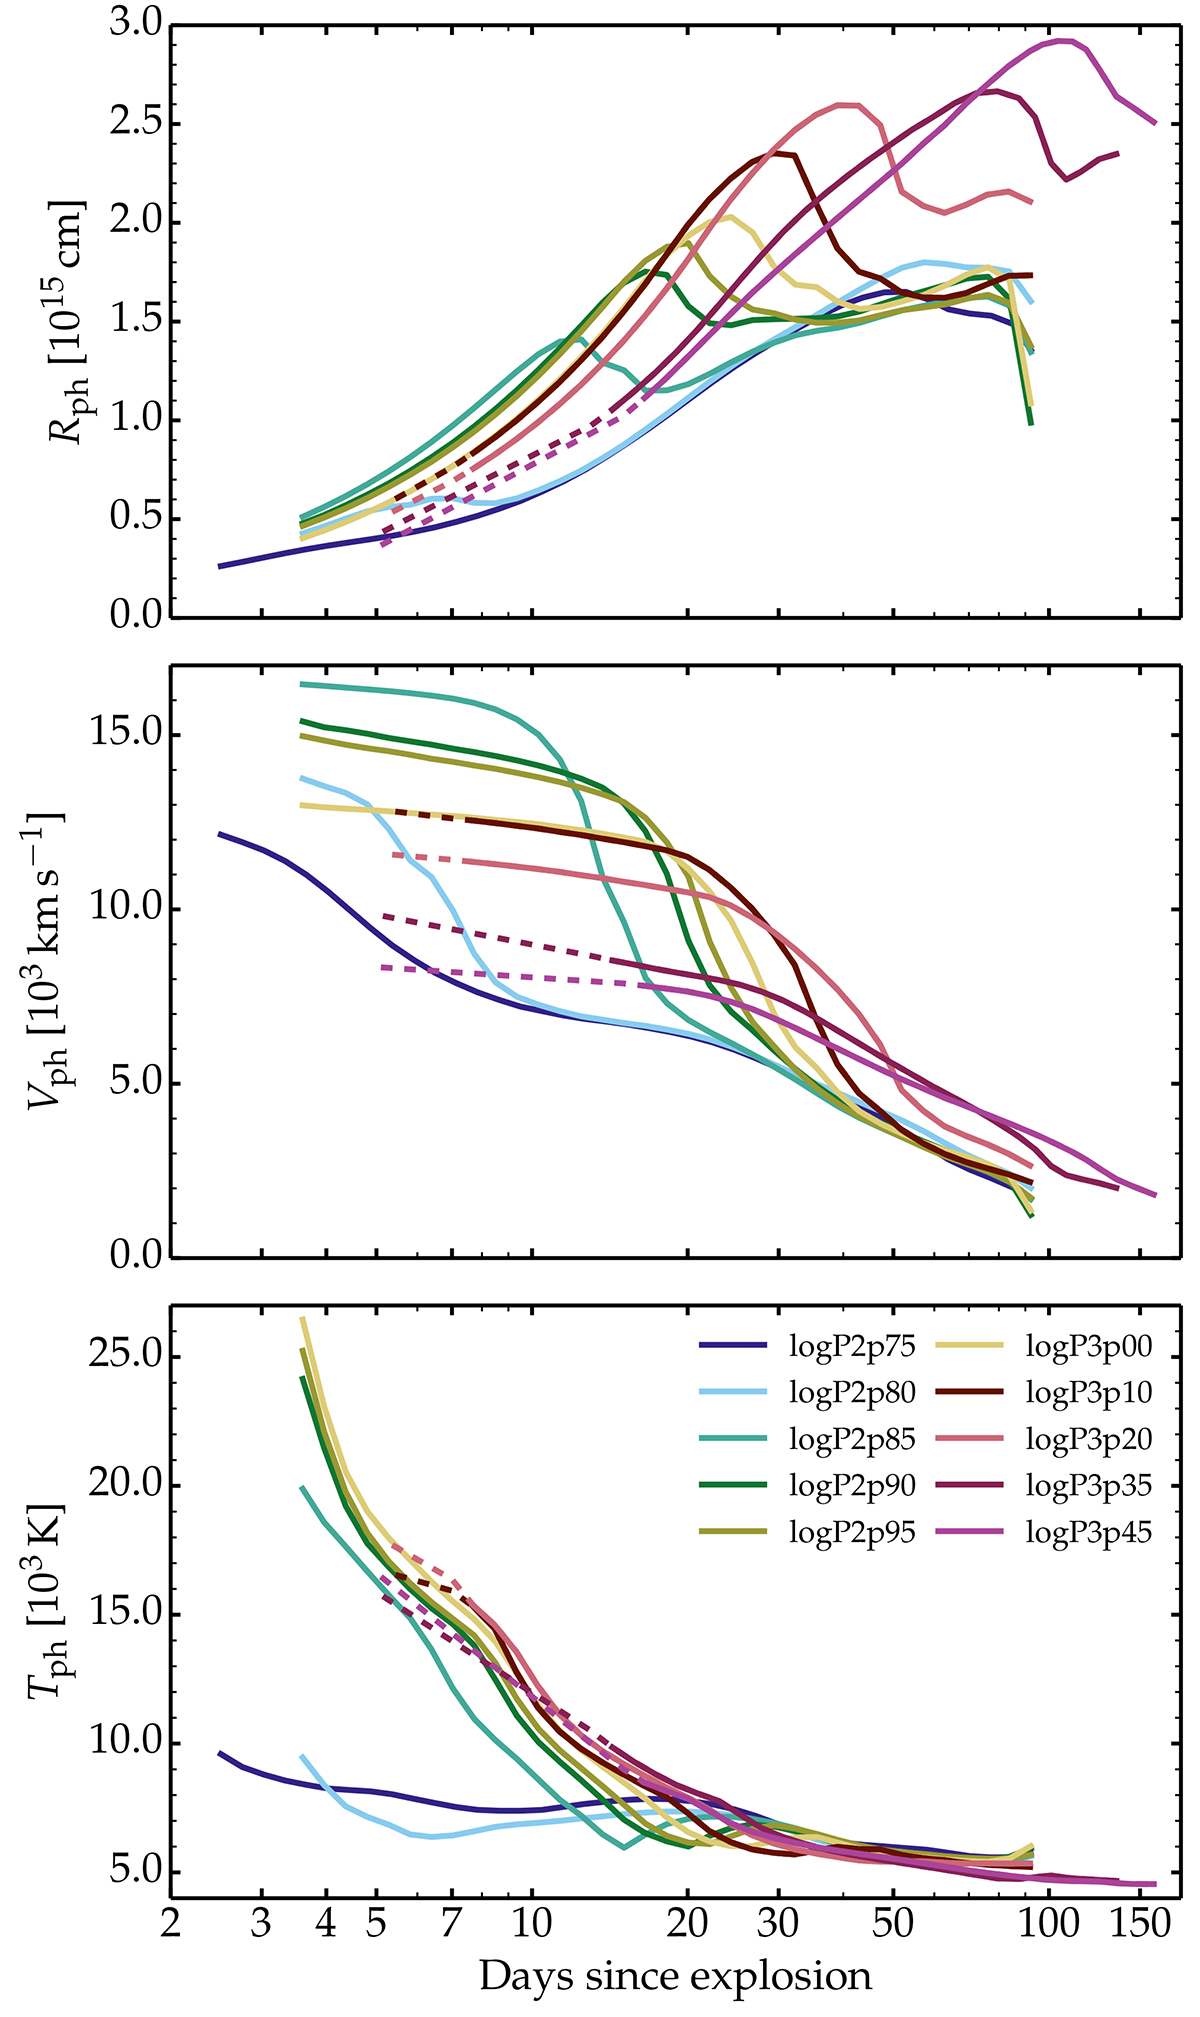
Evolution of photospheric properties for our model set. From top to bottom, we show the evolution (the x-axis is shown in logarithmic scale to better reveal the rapid changes at early times) of the radius (top), velocity (middle), and gas temperature (bottom) at the location where the inward integrated electron scattering optical depth is equal to 2/3. The dashed lines correspond to early epochs for models logP3p10 to logP3p45 in which we computed single snapshots based on V1D inputs.
Current usage metrics show cumulative count of Article Views (full-text article views including HTML views, PDF and ePub downloads, according to the available data) and Abstracts Views on Vision4Press platform.
Data correspond to usage on the plateform after 2015. The current usage metrics is available 48-96 hours after online publication and is updated daily on week days.
Initial download of the metrics may take a while.