Fig. A.4.
Download original image
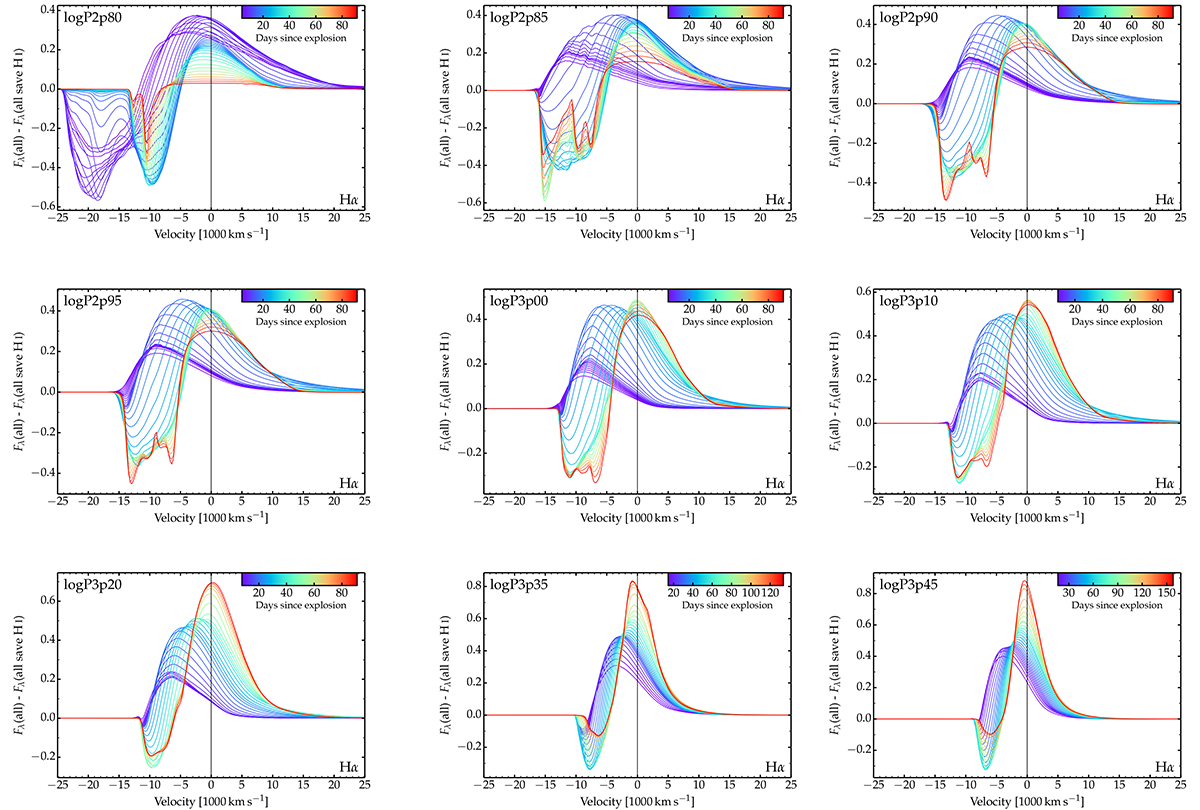
Evolution of the Hα profile for our set of models. We show the flux obtained by accounting for all bound-bound transitions subtracted from the flux obtained by ignoring those associated with H I. The fluxes are normalized by the peak Hα flux in the “full” model. These profiles are used to compute the ratio of the absorption to the emission flux in Hα (see Fig. 7).
Current usage metrics show cumulative count of Article Views (full-text article views including HTML views, PDF and ePub downloads, according to the available data) and Abstracts Views on Vision4Press platform.
Data correspond to usage on the plateform after 2015. The current usage metrics is available 48-96 hours after online publication and is updated daily on week days.
Initial download of the metrics may take a while.