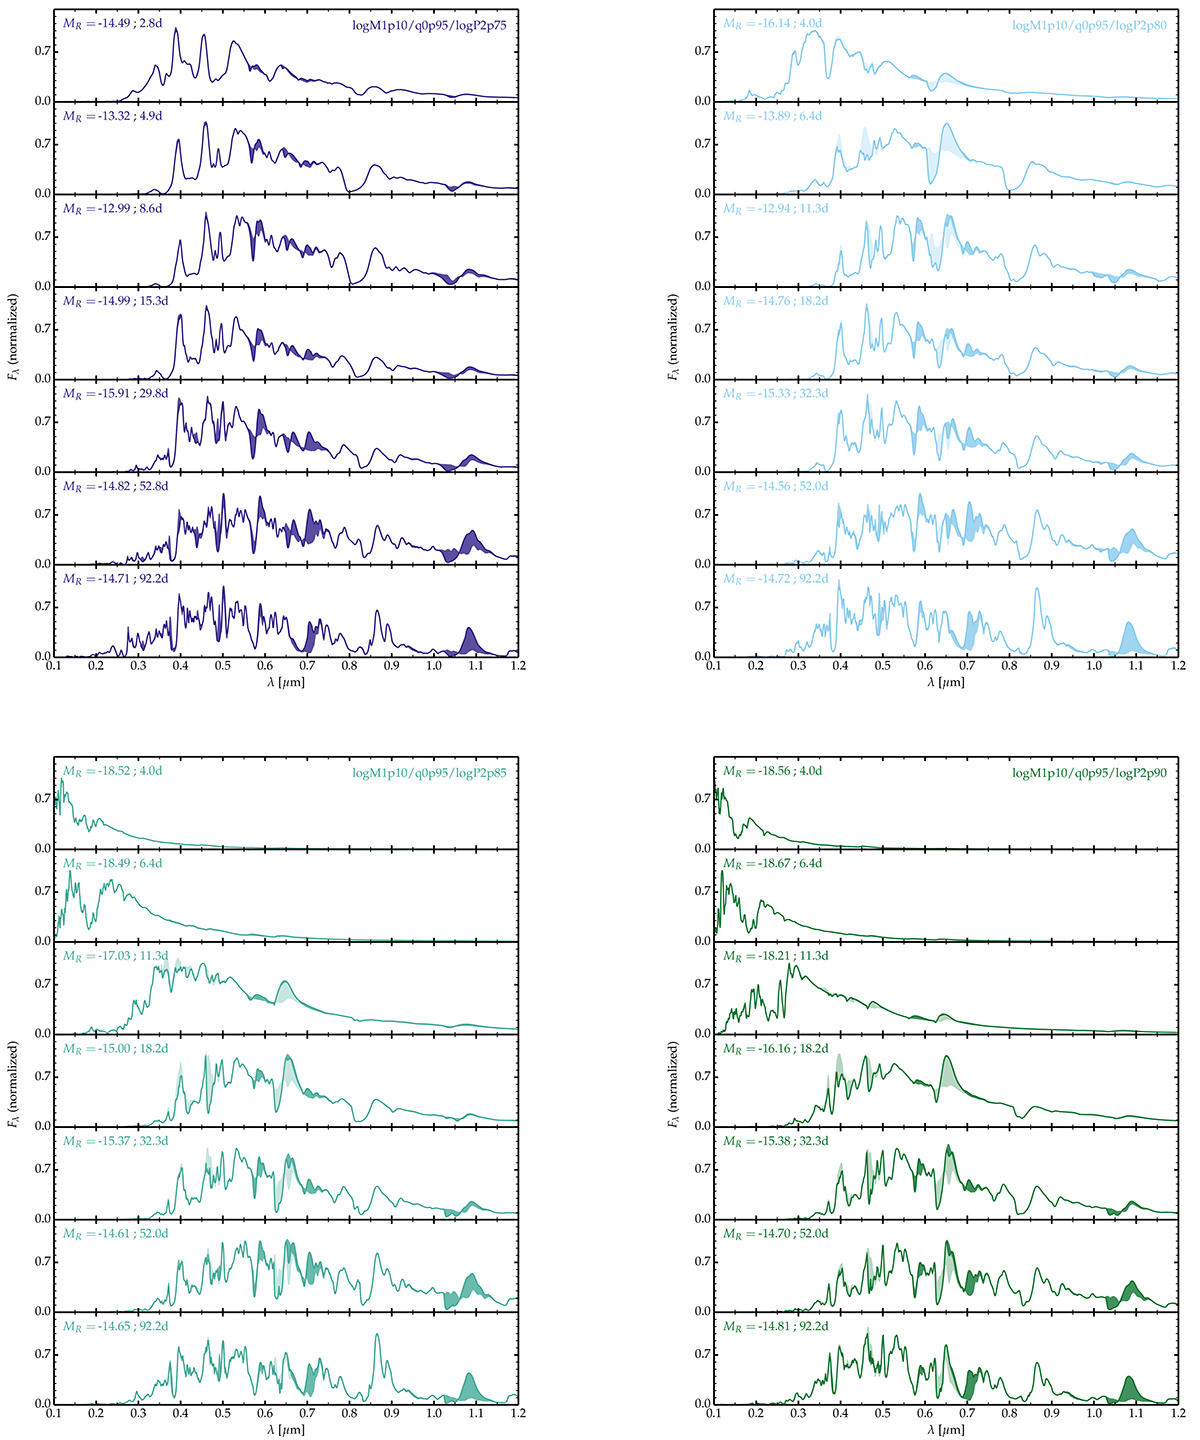
Fig. A.1.
Download original image
Spectral evolution of models logP2p75, logP2p80, logP2p85, and logP2p90. The CMFGEN time sequences are computed at time steps ti such that ti + 1/ti= 1.1. Here, we show fewer time steps for better visibility so that tiplot + 1/tiplot∼ 1.3. As for Fig. 6, we illustrate the flux associated with He I lines (dark shade) and H I lines (light shade).
Current usage metrics show cumulative count of Article Views (full-text article views including HTML views, PDF and ePub downloads, according to the available data) and Abstracts Views on Vision4Press platform.
Data correspond to usage on the plateform after 2015. The current usage metrics is available 48-96 hours after online publication and is updated daily on week days.
Initial download of the metrics may take a while.