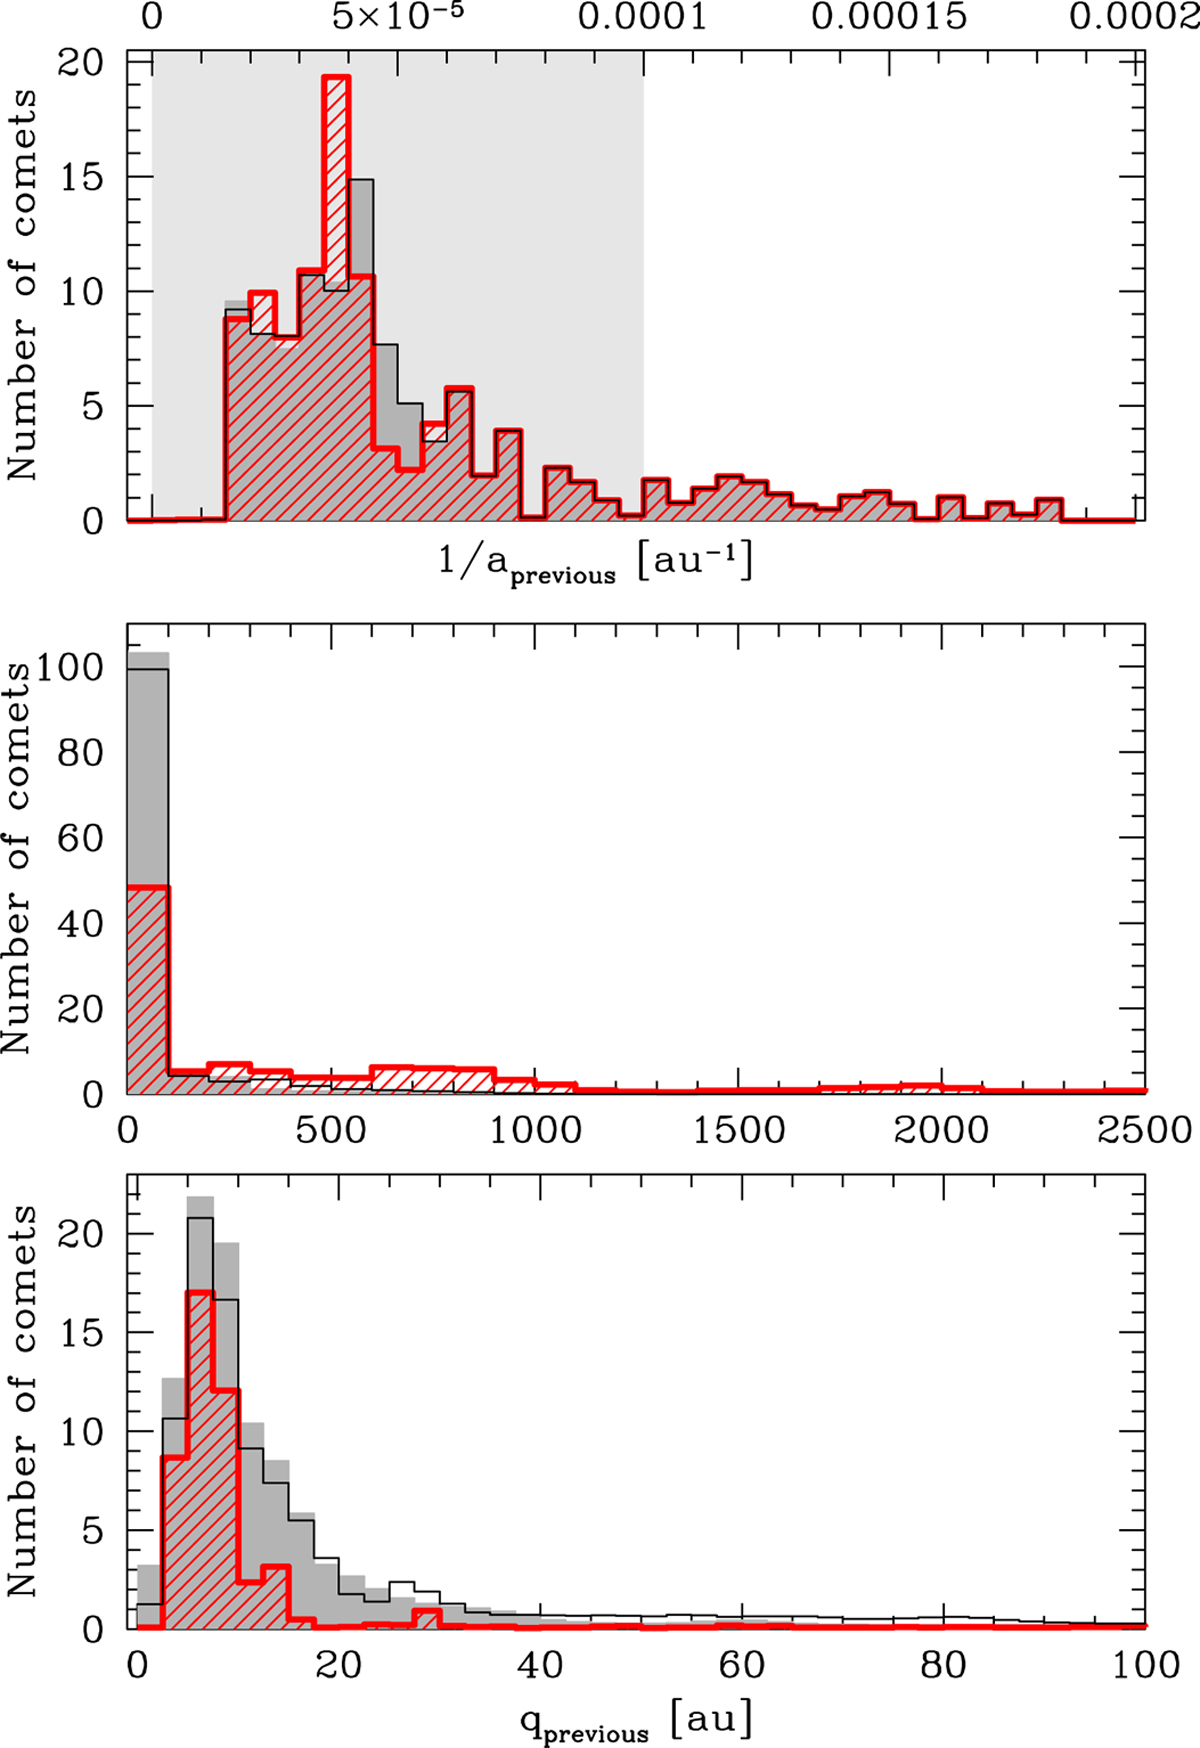
Fig. 4
Download original image
Statistics for 125 LPCs with the osculating perihelion distance greater than 3.5 au described in Sect. 6.1. Upper panel: the distribution of previous 1 /a, where the filled grey histogram represents calculations with Galactic tide perturbations (stellar perturbations are ignored), the black-lined histogram represents results including perturbations from all stars except HD 7977, and the red dashed histogram describes the case with perturbations from the Galactic tide and all stars. The light-grey vertical band shows the area traditionally called the Oort spike. The middle and lower panels show the distribution of the previous perihelion distance; the lower panel gives details about the first bin (1–100 au) of the middle panel.
Current usage metrics show cumulative count of Article Views (full-text article views including HTML views, PDF and ePub downloads, according to the available data) and Abstracts Views on Vision4Press platform.
Data correspond to usage on the plateform after 2015. The current usage metrics is available 48-96 hours after online publication and is updated daily on week days.
Initial download of the metrics may take a while.