Fig. 10
Download original image
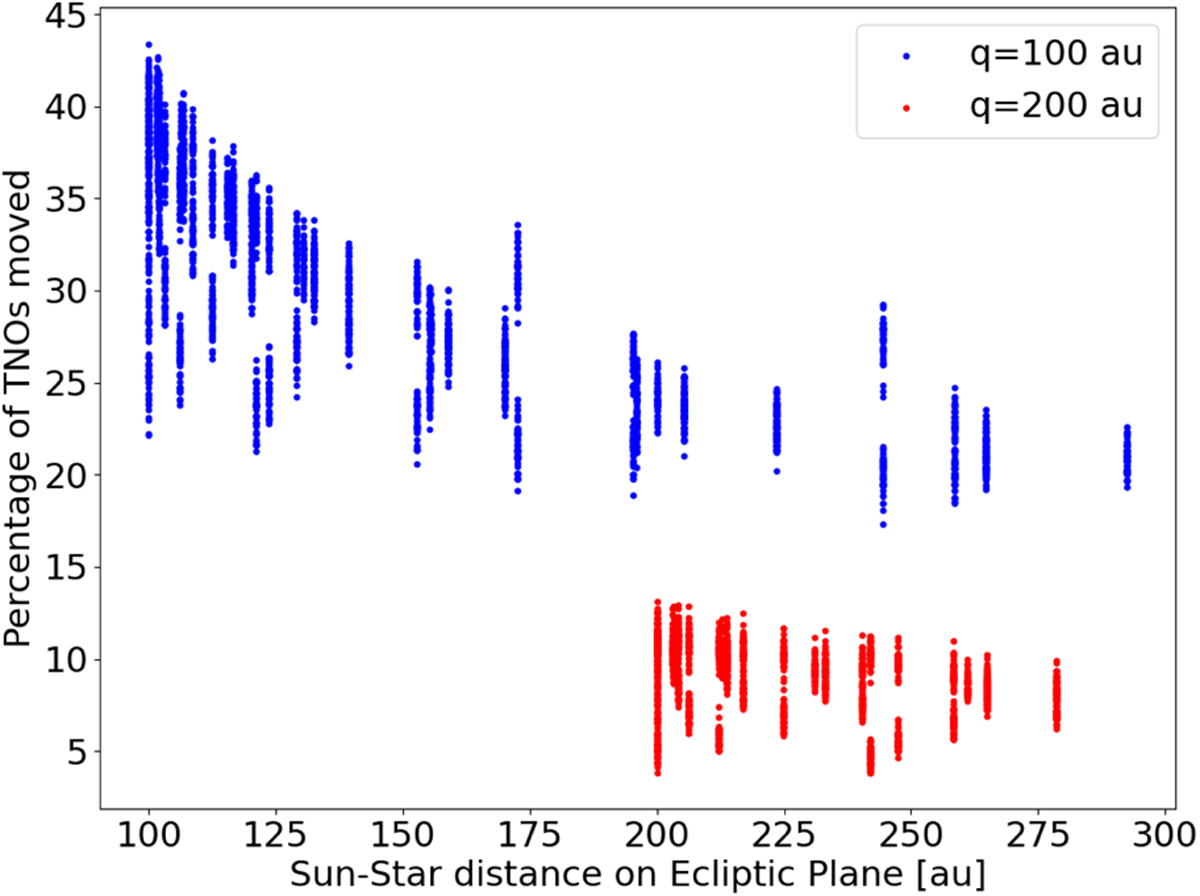
Effect of different flybys on distant TNOs. The plot shows the percentage of simulated objects with an initial semimajor axis between 50 and 100 au and eccentricity <0.25, that have orbital parameters outside this range after a flyby. Each point represents the single simulation of a stellar flyby with a perihelion distance of the Star q equal to 100 or 200 au and different flyby geometry.
Current usage metrics show cumulative count of Article Views (full-text article views including HTML views, PDF and ePub downloads, according to the available data) and Abstracts Views on Vision4Press platform.
Data correspond to usage on the plateform after 2015. The current usage metrics is available 48-96 hours after online publication and is updated daily on week days.
Initial download of the metrics may take a while.