Fig. 19
Download original image
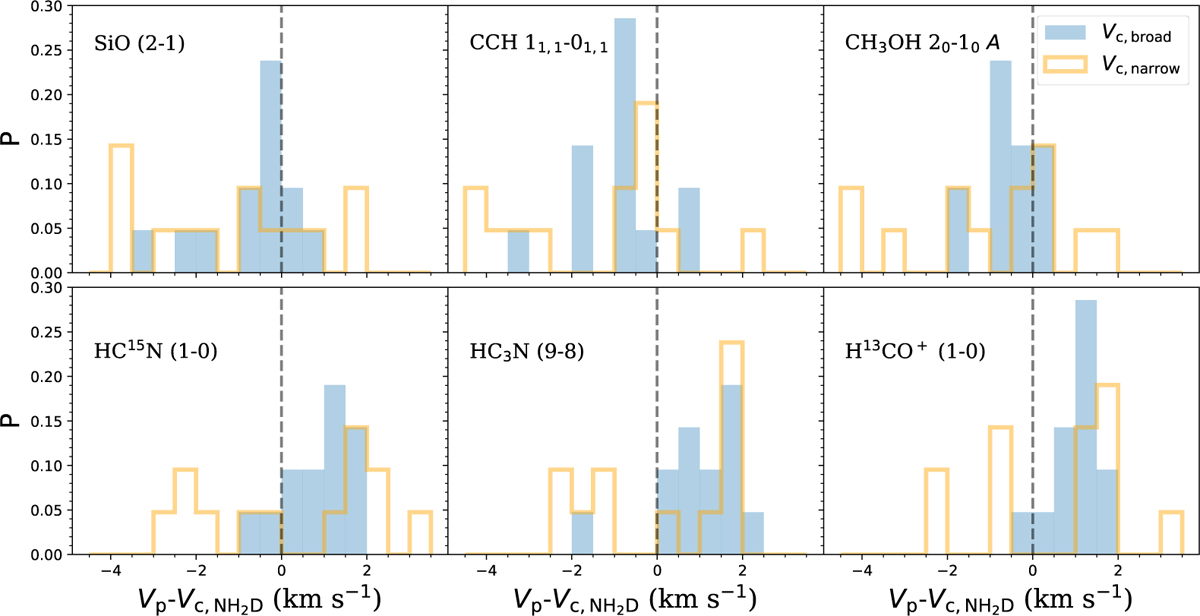
Probability distribution of velocity offset between peak velocities of multiple lines with respect to the centroid velocity of NH2D lines of NH2D cores. The peak velocity, Vp, is given by the corresponding molecular line noted in upper left corner of each subplot; ![]() indicate the centroid velocity of the broad-linewidth component or the narrow-linewidth component of the two-component fits to NH2D lines (Fig. D.1).
indicate the centroid velocity of the broad-linewidth component or the narrow-linewidth component of the two-component fits to NH2D lines (Fig. D.1).
Current usage metrics show cumulative count of Article Views (full-text article views including HTML views, PDF and ePub downloads, according to the available data) and Abstracts Views on Vision4Press platform.
Data correspond to usage on the plateform after 2015. The current usage metrics is available 48-96 hours after online publication and is updated daily on week days.
Initial download of the metrics may take a while.