Fig. 4.
Download original image
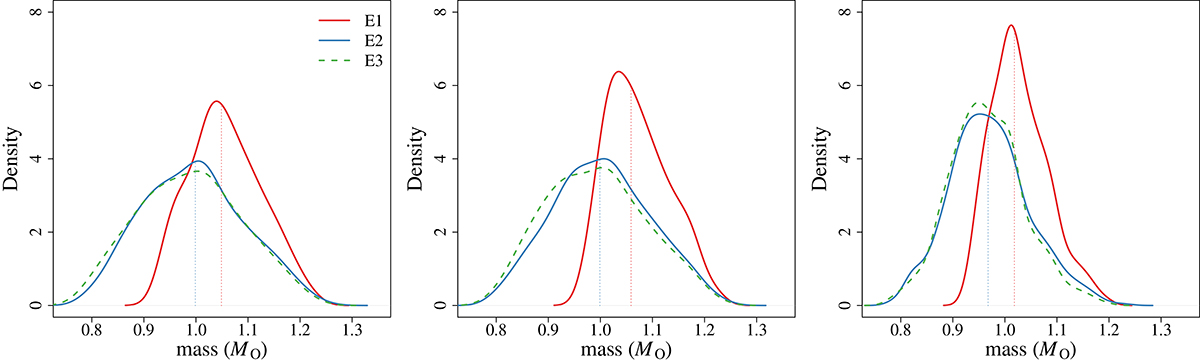
Kernel density estimator of the mass distribution of models in the [α/Fe]=0.3 grid entering the 2σ box around the reference point at M = 1.0 M⊙ and Δν = 0.06 in the [α/Fe]=0.0 grid at three different initial [Fe/H] values. Left: distribution of the masses at [Fe/H] = 0.2. The red line corresponds to error E1, the blue line to E2, and the green line to increased uncertainty only in effective temperature. The dotted lines mark the median of the respective distributions. Middle: same as in the left panel but for [Fe/H] = 0.0. Right: same as in the left panel but for [Fe/H] = −0.6.
Current usage metrics show cumulative count of Article Views (full-text article views including HTML views, PDF and ePub downloads, according to the available data) and Abstracts Views on Vision4Press platform.
Data correspond to usage on the plateform after 2015. The current usage metrics is available 48-96 hours after online publication and is updated daily on week days.
Initial download of the metrics may take a while.