Fig. 5.

Download original image
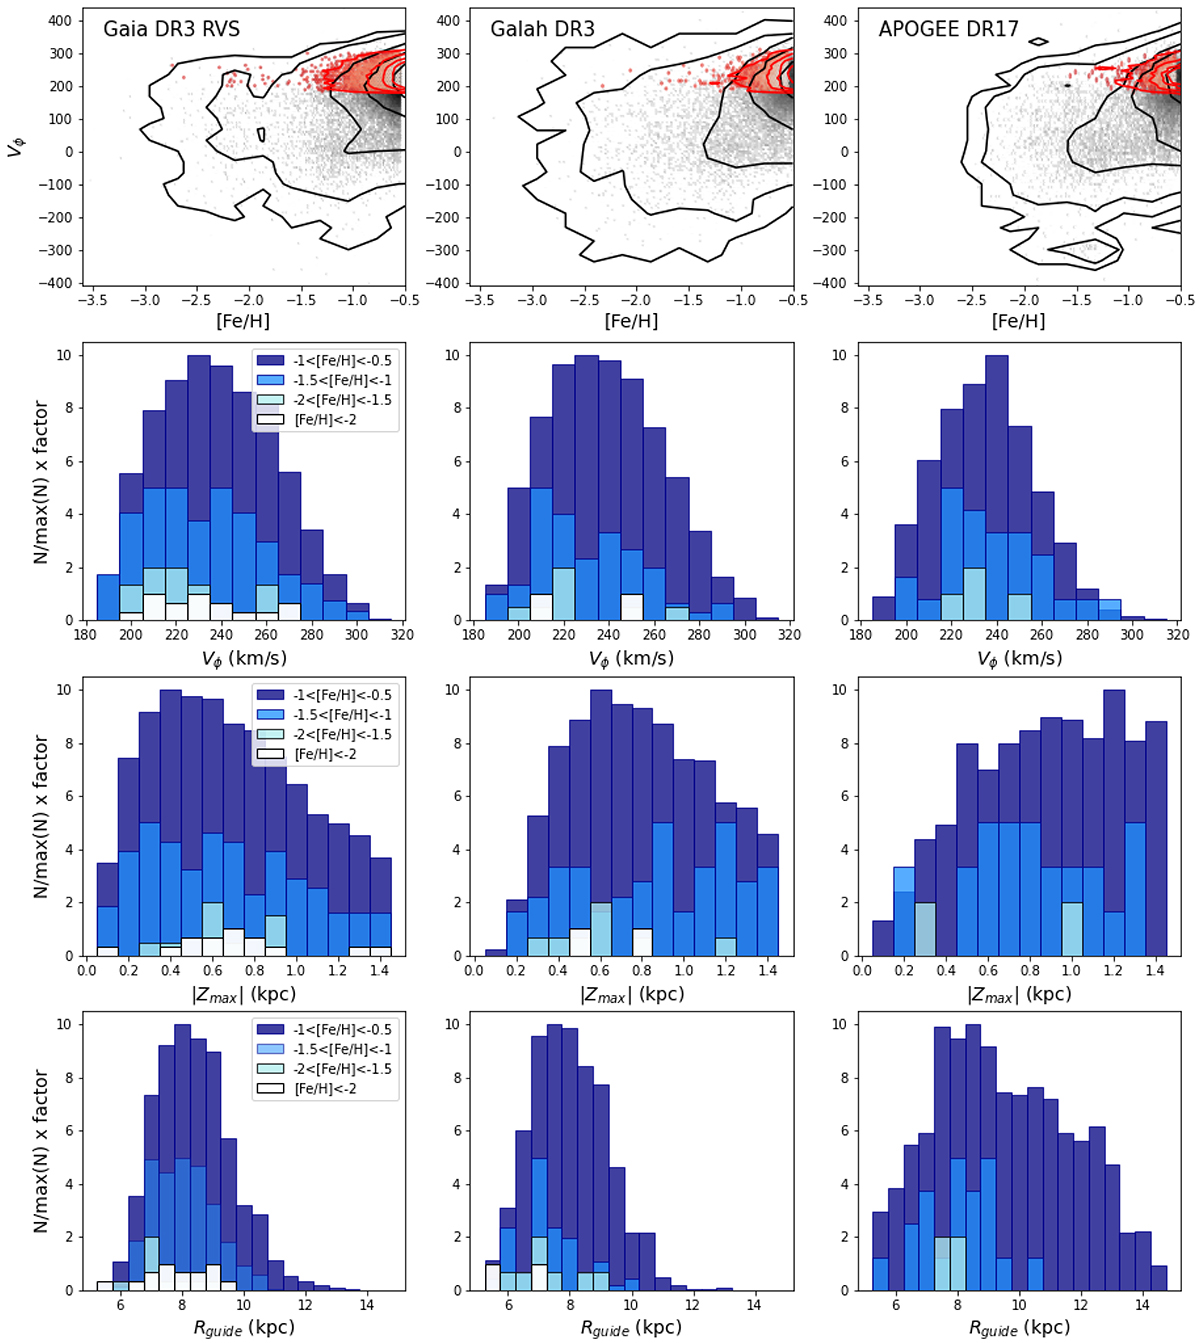
Rotational velocity, Vϕ, as a function of the metallicity, [Fe/H], color coded by density scale, for the thin disc selections (top row). Thin-disc stars are shown in red scale overplotted over the rest of the sample in grey scale. Contour plots of the 50%, 75%, 90%, 99%, and 99.9% (the latter only for the metal-poor thin disc) are overplotted following the same color code. Second row: Vϕ distributions of thin-disc stars at four different ranges of metallicity (from dark blue to white, [Fe/H] < −0.5, [Fe/H] < −1, [Fe/H] < −1.5, [Fe/H] < −2), normalized to the maximum number of stars and multiplied by a factor to help the visualization (from dark blue to white, ×10, ×5, ×2 and ×1). Third and fourth rows: same as middle panels but for |Zmax| and Rguide distributions, respectively. From left to right we display the Gaia DR3 RVS, GALAH and APOGEE stellar samples.
Current usage metrics show cumulative count of Article Views (full-text article views including HTML views, PDF and ePub downloads, according to the available data) and Abstracts Views on Vision4Press platform.
Data correspond to usage on the plateform after 2015. The current usage metrics is available 48-96 hours after online publication and is updated daily on week days.
Initial download of the metrics may take a while.


