Fig. B.1.
Download original image
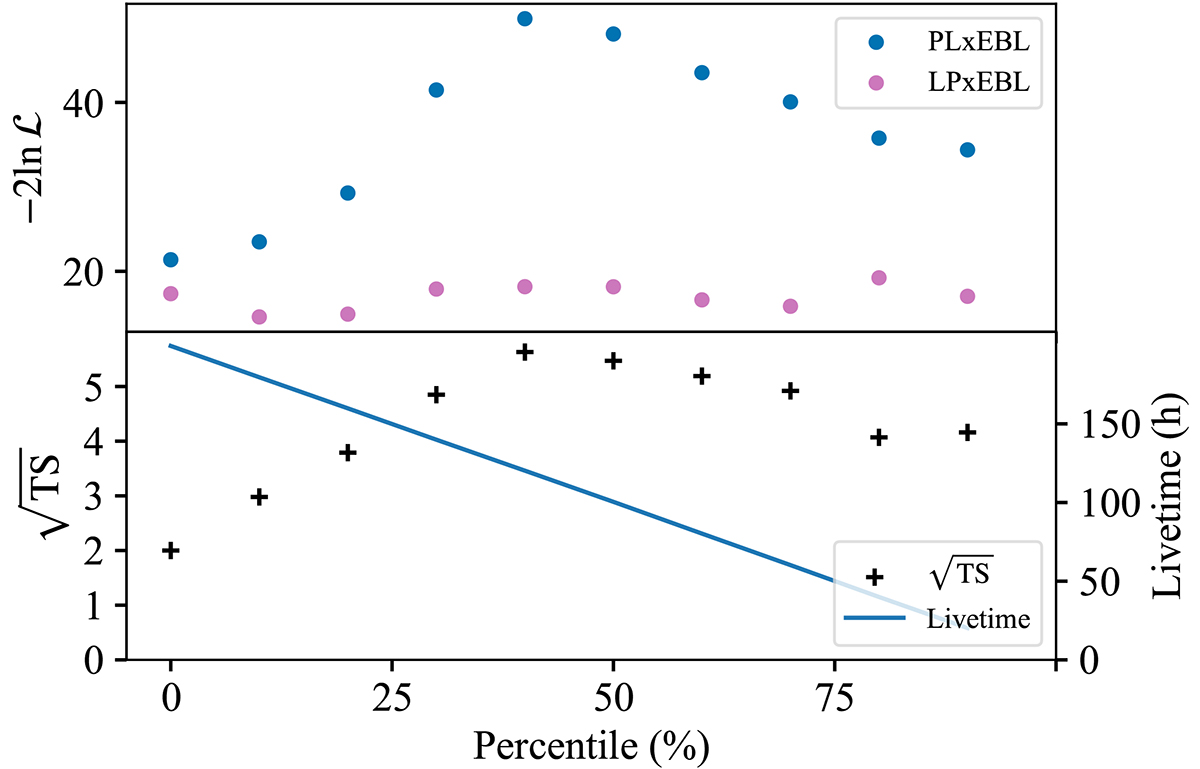
TS distribution for the PLxEBL (blue) and LPxEBL (purple) models, incorporating the finke2022 EBL model, is analyzed in relation to datasets defined by the flux distribution above 1 TeV. Each dataset encompasses observations with flux surpassing a specified percentile. The lower panel presents the distribution of ![]() denoted by black crosses, while the solid line illustrates the dataset’s livetime distribution.
denoted by black crosses, while the solid line illustrates the dataset’s livetime distribution.
Current usage metrics show cumulative count of Article Views (full-text article views including HTML views, PDF and ePub downloads, according to the available data) and Abstracts Views on Vision4Press platform.
Data correspond to usage on the plateform after 2015. The current usage metrics is available 48-96 hours after online publication and is updated daily on week days.
Initial download of the metrics may take a while.