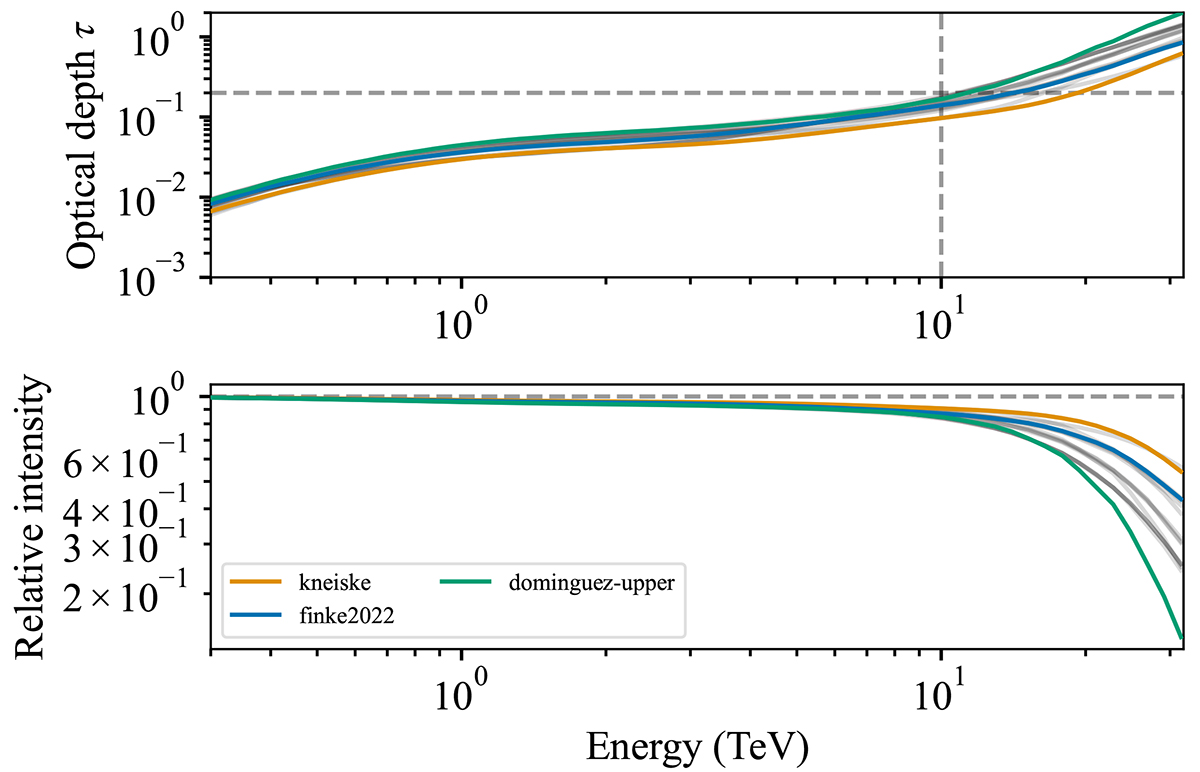
Fig. A.1.
Download original image
Optical depth (top) and the relative intensity of the gamma-ray flux after absorption (bottom) at z≈0.0042 of the three EBL models employed in this study are presented based on the information provided in the table from Meyer (2022). The two dashed lines in the upper panel indicate the energy and attenuation levels at which we deem the influence of the EBL spectrum on the overall spectrum as non-negligible. Additionally, for comparison, the remaining available EBL models are depicted in faded black. In the bottom panel, a reference dashed line is provided to guide the eyes in the case of no absorption.
Current usage metrics show cumulative count of Article Views (full-text article views including HTML views, PDF and ePub downloads, according to the available data) and Abstracts Views on Vision4Press platform.
Data correspond to usage on the plateform after 2015. The current usage metrics is available 48-96 hours after online publication and is updated daily on week days.
Initial download of the metrics may take a while.