Fig. 3.
Download original image
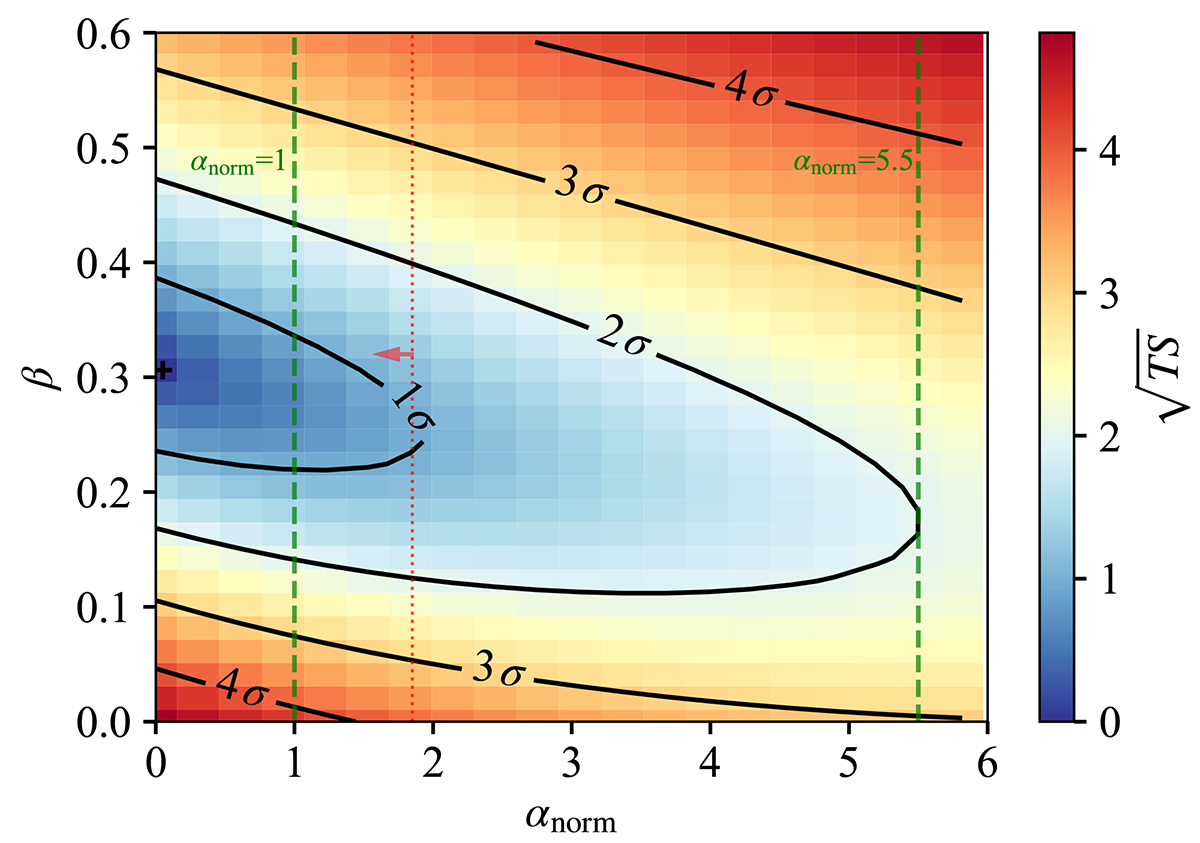
Parameter space around the best-fit LPxEBL spectral model for the αnorm and β parameters of the finke2022 EBL model. The color map gives the distance in standard deviations from the best-fit parameters (shown by the black cross), i.e., the lowest value provides the best fit. The black contours give the 1σ, 2σ, 3σ, and 4σ uncertainty contours. The vertical green lines show the αnorm = 1 and αnorm = 5.5, which provides the 95% c.l. UL on the α parameter. For comparison, the dotted red line shows the αnorm that corresponds to the UL above which the finke2022 EBL model would start to contradict the ULs from Biteau & Williams (2015).
Current usage metrics show cumulative count of Article Views (full-text article views including HTML views, PDF and ePub downloads, according to the available data) and Abstracts Views on Vision4Press platform.
Data correspond to usage on the plateform after 2015. The current usage metrics is available 48-96 hours after online publication and is updated daily on week days.
Initial download of the metrics may take a while.