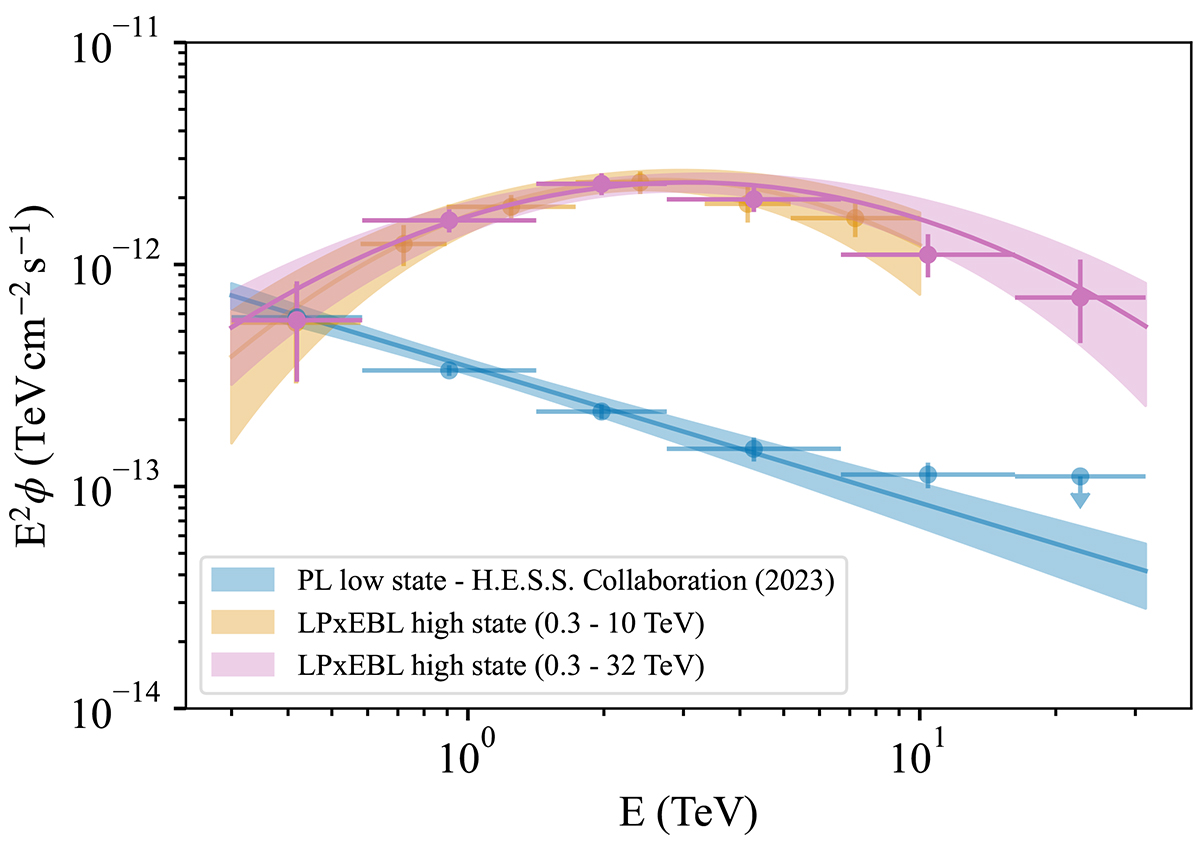
Fig. 2.
Download original image
Detected spectral energy distribution of M 87 data with H.E.S.S. The best-fit LPxEBL finke2022 spectral models are shown in yellow for the reduced energy range (0.3 − 10 TeV) and in purple for the full energy range (0.3 − 32 TeV). The best-fit PL spectrum for the low-state data (based on H.E.S.S. Collaboration 2023) is shown for comparison in blue. The color bands show the 1σ uncertainty contours. The upper limit (UL) in the last bin of the low-state spectrum is defined at a 95% confidence level (c.l.).
Current usage metrics show cumulative count of Article Views (full-text article views including HTML views, PDF and ePub downloads, according to the available data) and Abstracts Views on Vision4Press platform.
Data correspond to usage on the plateform after 2015. The current usage metrics is available 48-96 hours after online publication and is updated daily on week days.
Initial download of the metrics may take a while.