Open Access
Fig. 1.
Download original image
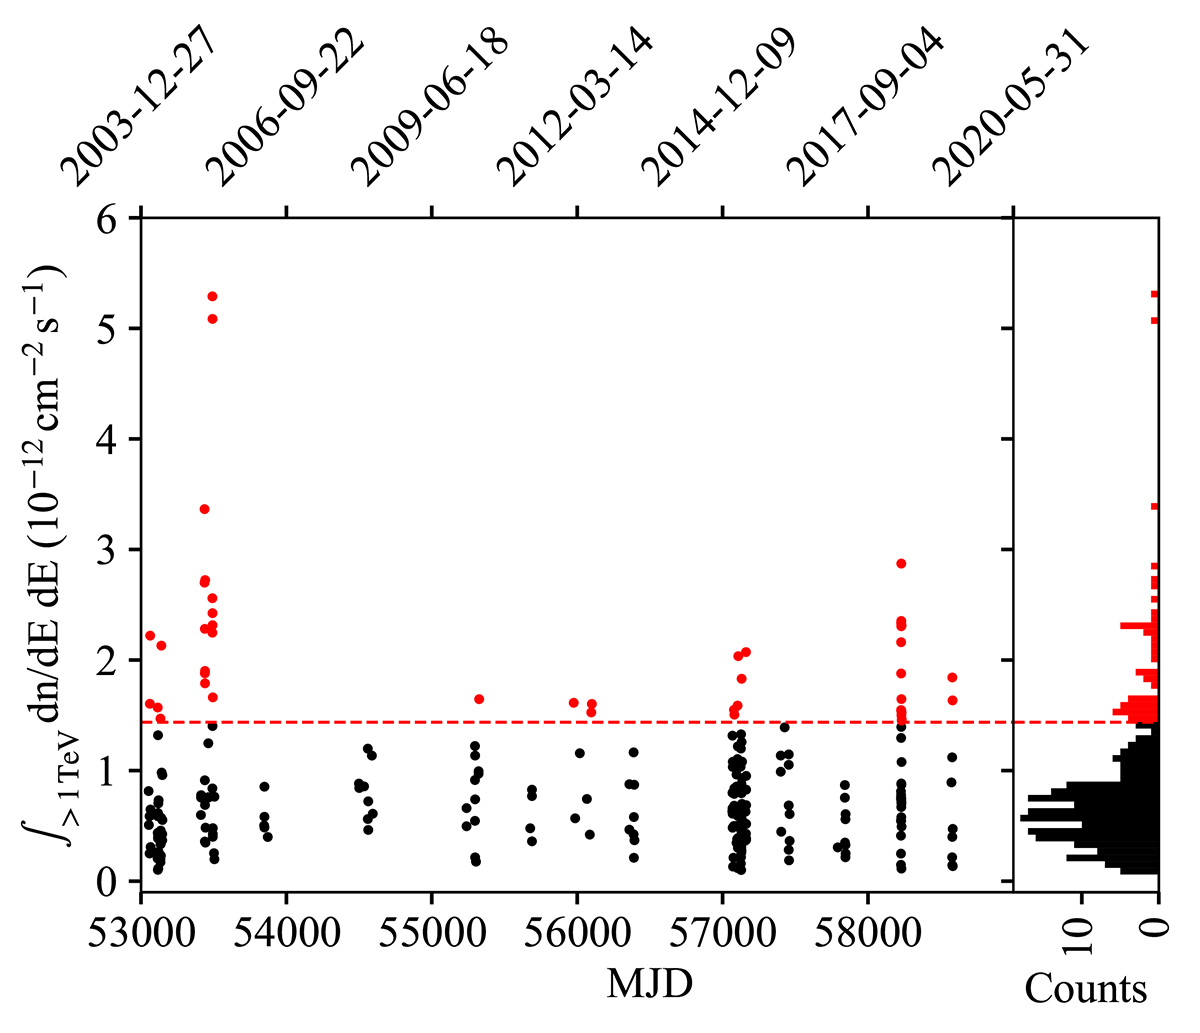
Gamma-ray flux above 1 TeV per observation run. The high state is defined by the 10% highest flux above 1 TeV, as indicated by the red data points (above the 90% percentile of the distribution). In the inset on the right side, a histogram with number of observational runs below and above the 90% percentile is shown.
Current usage metrics show cumulative count of Article Views (full-text article views including HTML views, PDF and ePub downloads, according to the available data) and Abstracts Views on Vision4Press platform.
Data correspond to usage on the plateform after 2015. The current usage metrics is available 48-96 hours after online publication and is updated daily on week days.
Initial download of the metrics may take a while.