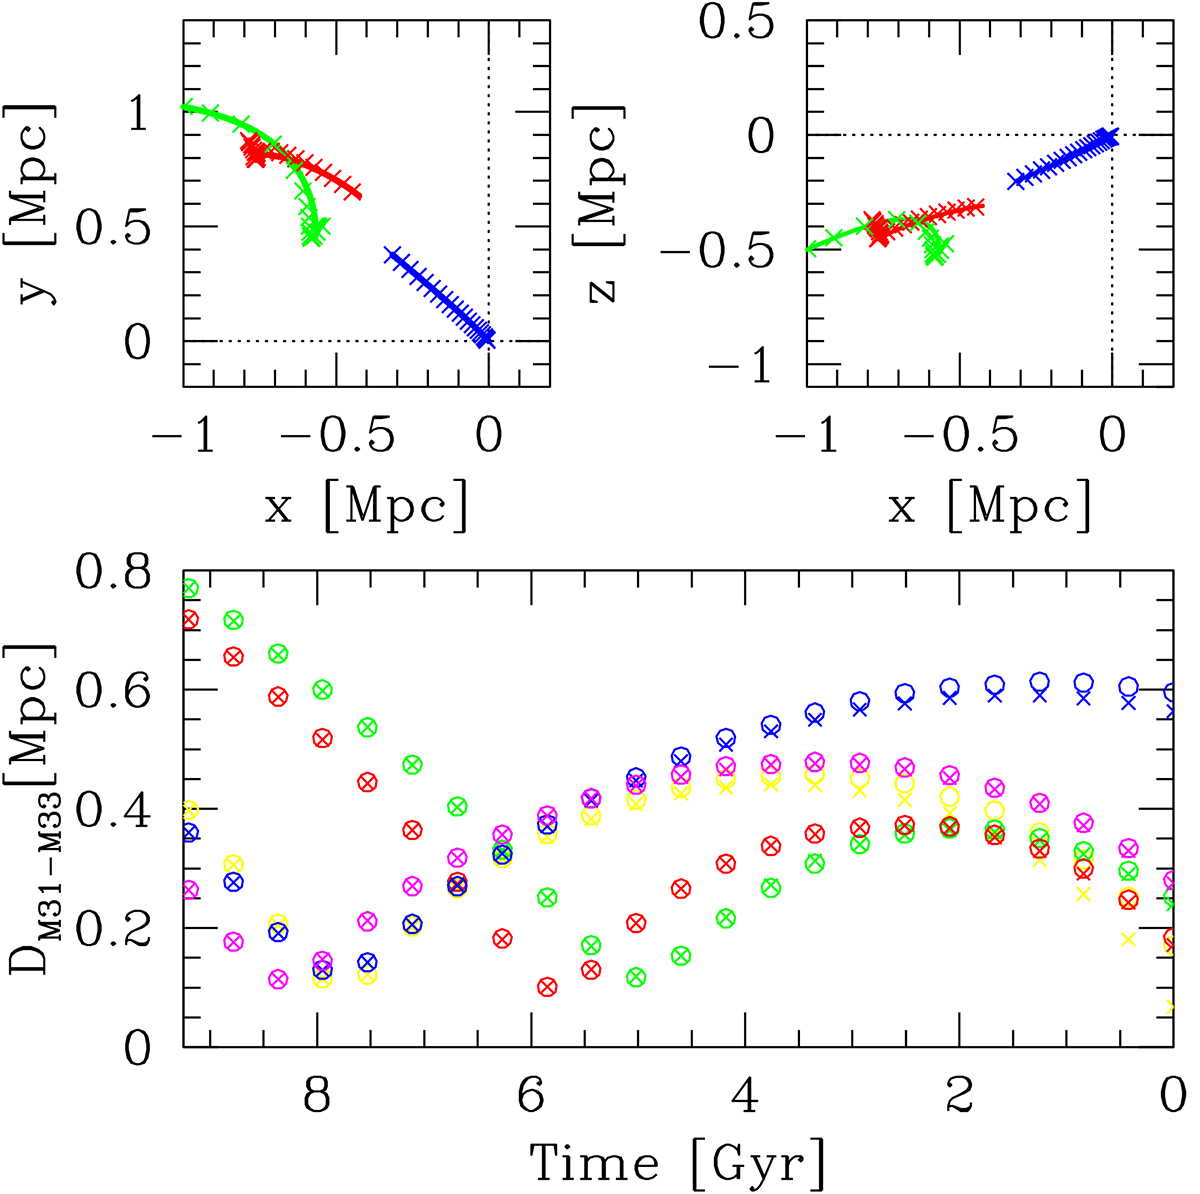
Fig. B.2.
Download original image
Comparison between results of test-particle and N-body simulations for the orbital evolution of Local Group spirals. Upper panels: Orbital evolution of the centre of mass of MW (blue), M31(red), and M33(green) for a set of initial conditions. Continuous lines are for test-particle simulations with C = 1 and crosses are the results from the corresponding N-body simulations. Bottom panel: Time evolution of the M31-M33 separation as given by N-body simulations for five sets of initial conditions (corresponding to the five colours) with C = 1.0. The open circles are for simulations that used 10000 particles for each galaxy while crosses refer to simulations with 40000 particles for each galaxy.
Current usage metrics show cumulative count of Article Views (full-text article views including HTML views, PDF and ePub downloads, according to the available data) and Abstracts Views on Vision4Press platform.
Data correspond to usage on the plateform after 2015. The current usage metrics is available 48-96 hours after online publication and is updated daily on week days.
Initial download of the metrics may take a while.