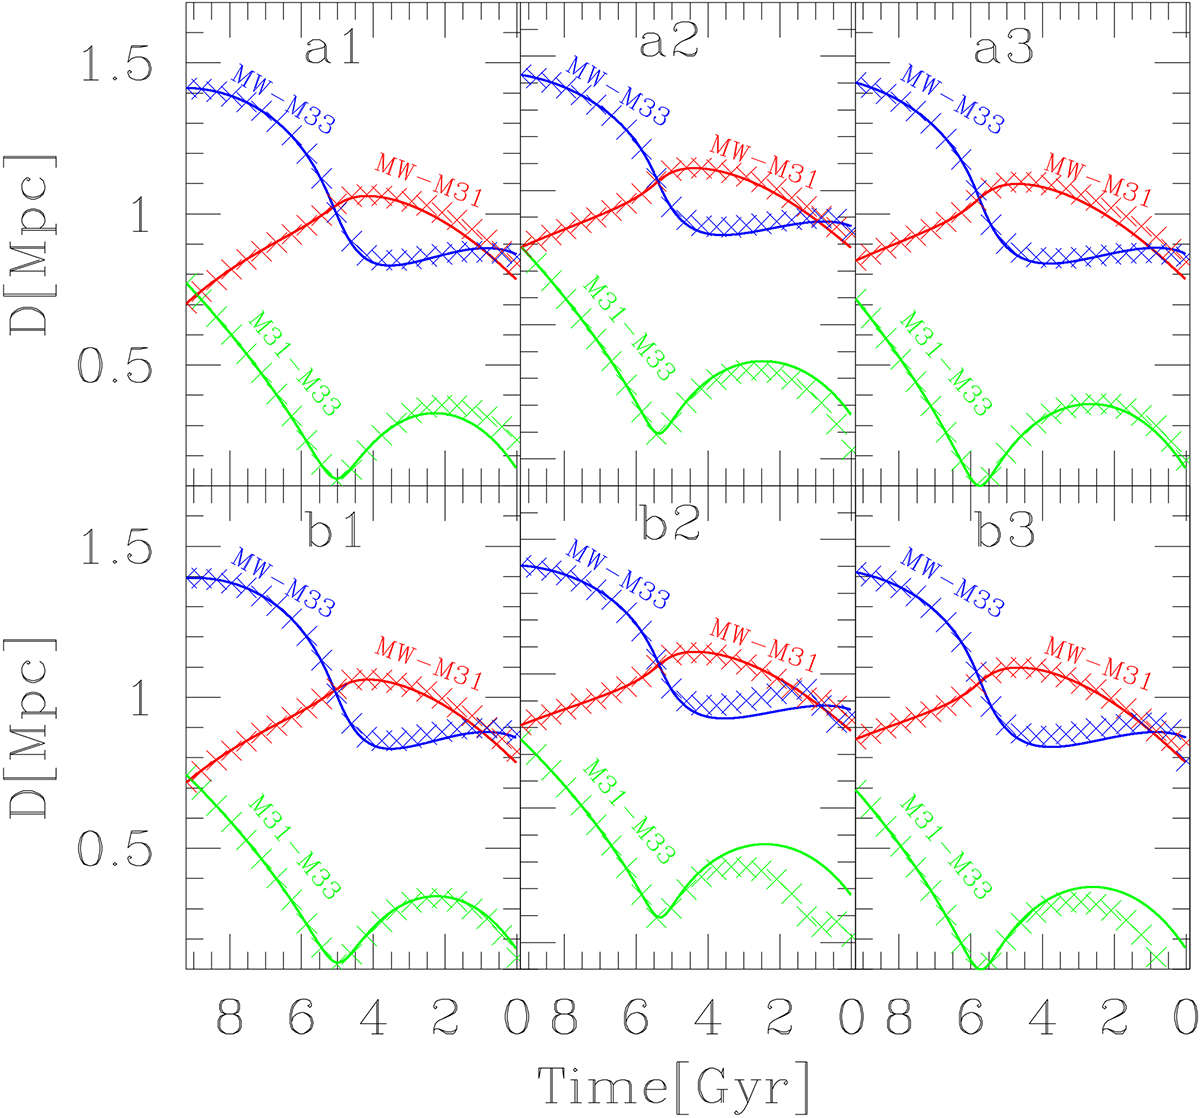
Fig. B.1.
Download original image
Time evolution of galaxy separations for three different sets of initial conditions at t = 9.2 (today): the continuous lines in panels a1, a2, and a3 refer to the results of test-particle simulations for C = 1.0; panels b1, b2, and b3 are for the same initial conditions but for C = 0.88. Crosses in each panel indicate galaxy separations resulting from N-body simulations with the same initial conditions as test-particle simulations.
Current usage metrics show cumulative count of Article Views (full-text article views including HTML views, PDF and ePub downloads, according to the available data) and Abstracts Views on Vision4Press platform.
Data correspond to usage on the plateform after 2015. The current usage metrics is available 48-96 hours after online publication and is updated daily on week days.
Initial download of the metrics may take a while.