Fig. 6.
Download original image
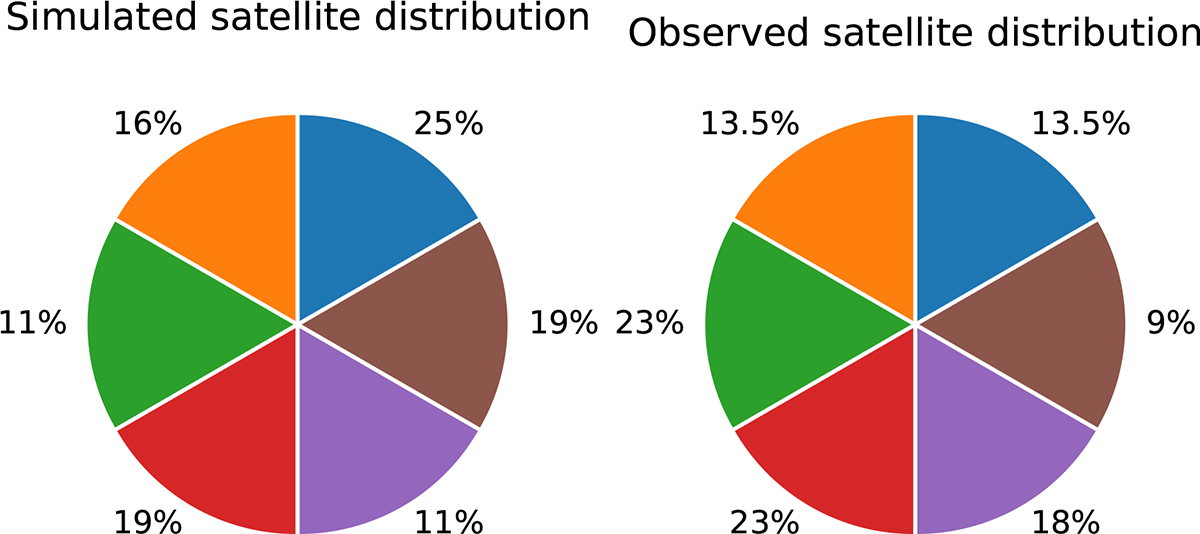
Comparison between the observed and simulated dark satellite distribution lying in projection beyond the outer HI disk of M33, averaged in 60° sectors. The observed distribution is from Grossi et al. (2008). The pie to the left summarises the average distribution of satellites in the various sectors for several simulated orbits of M33 with a close pericentre passage around M31 in the past. The percentages refer to the fraction of satellites observed or predicted in each angular sector.
Current usage metrics show cumulative count of Article Views (full-text article views including HTML views, PDF and ePub downloads, according to the available data) and Abstracts Views on Vision4Press platform.
Data correspond to usage on the plateform after 2015. The current usage metrics is available 48-96 hours after online publication and is updated daily on week days.
Initial download of the metrics may take a while.