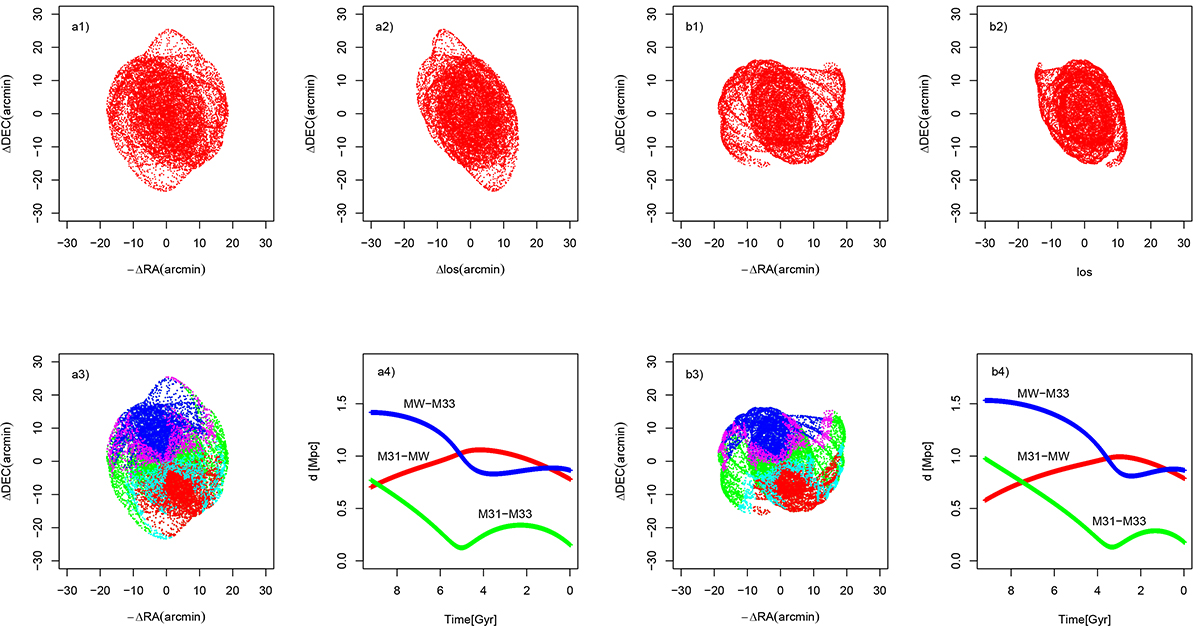
Fig. 4.
Download original image
Space distribution and line of sight velocities of test-particles in the M33 disk at t = 0 in the tangential frame and the time evolution of galaxy separations. They are results of a simulation that predicts tangential velocities shown by the blue star symbols in Fig. 3. Panels a refer to a standard mass model case, with the M31 mass equal to 1.5 × 10¹² M⊙. Panels b refer to a simulation for the highvar mass model, with M31 mass equal to 3.5 × 10¹² M⊙. ΔRA, ΔDec, and Δlos are the coordinate differences between the particle coordinates and the M33 centre coordinates. Panels a3 and b3 show the line of sight velocities of the M33 disk, with the green colour indicating velocities close to systemic, blue and red the more extreme approaching and receding velocities respectively. In panels a4 and b4 the time evolution of the relative distances between MW, M31 and M33 in Mpc from 9.2 Gyr ago to the present time are shown.
Current usage metrics show cumulative count of Article Views (full-text article views including HTML views, PDF and ePub downloads, according to the available data) and Abstracts Views on Vision4Press platform.
Data correspond to usage on the plateform after 2015. The current usage metrics is available 48-96 hours after online publication and is updated daily on week days.
Initial download of the metrics may take a while.