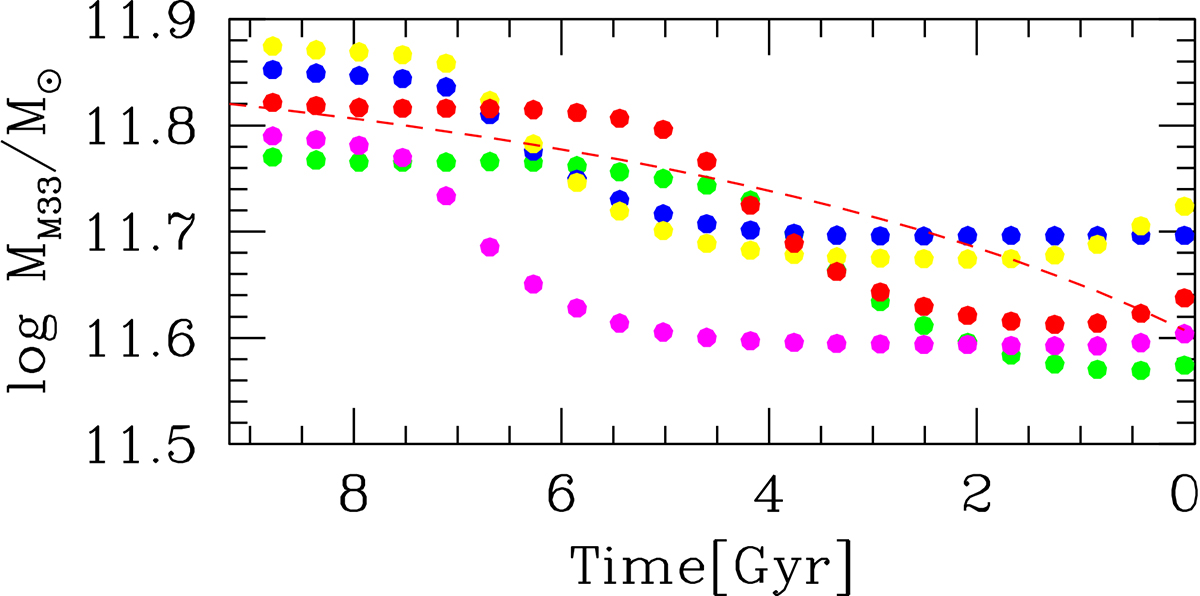
Fig. B.3.
Download original image
Results of N-body simulations for the time evolution of the M33 mass along five orbits (one for each colour) with a close pericentre passage of M33 around M31 in the past. The initial conditions and colour coding are the same as for cases shown in the bottom panel of Figure B.2. The red dashed line shows for comparison the analytical expression used in the semi-analytical computation to describe time variations of the M33 mass for the case shown by the red filled dots.
Current usage metrics show cumulative count of Article Views (full-text article views including HTML views, PDF and ePub downloads, according to the available data) and Abstracts Views on Vision4Press platform.
Data correspond to usage on the plateform after 2015. The current usage metrics is available 48-96 hours after online publication and is updated daily on week days.
Initial download of the metrics may take a while.