Fig. 1.
Download original image
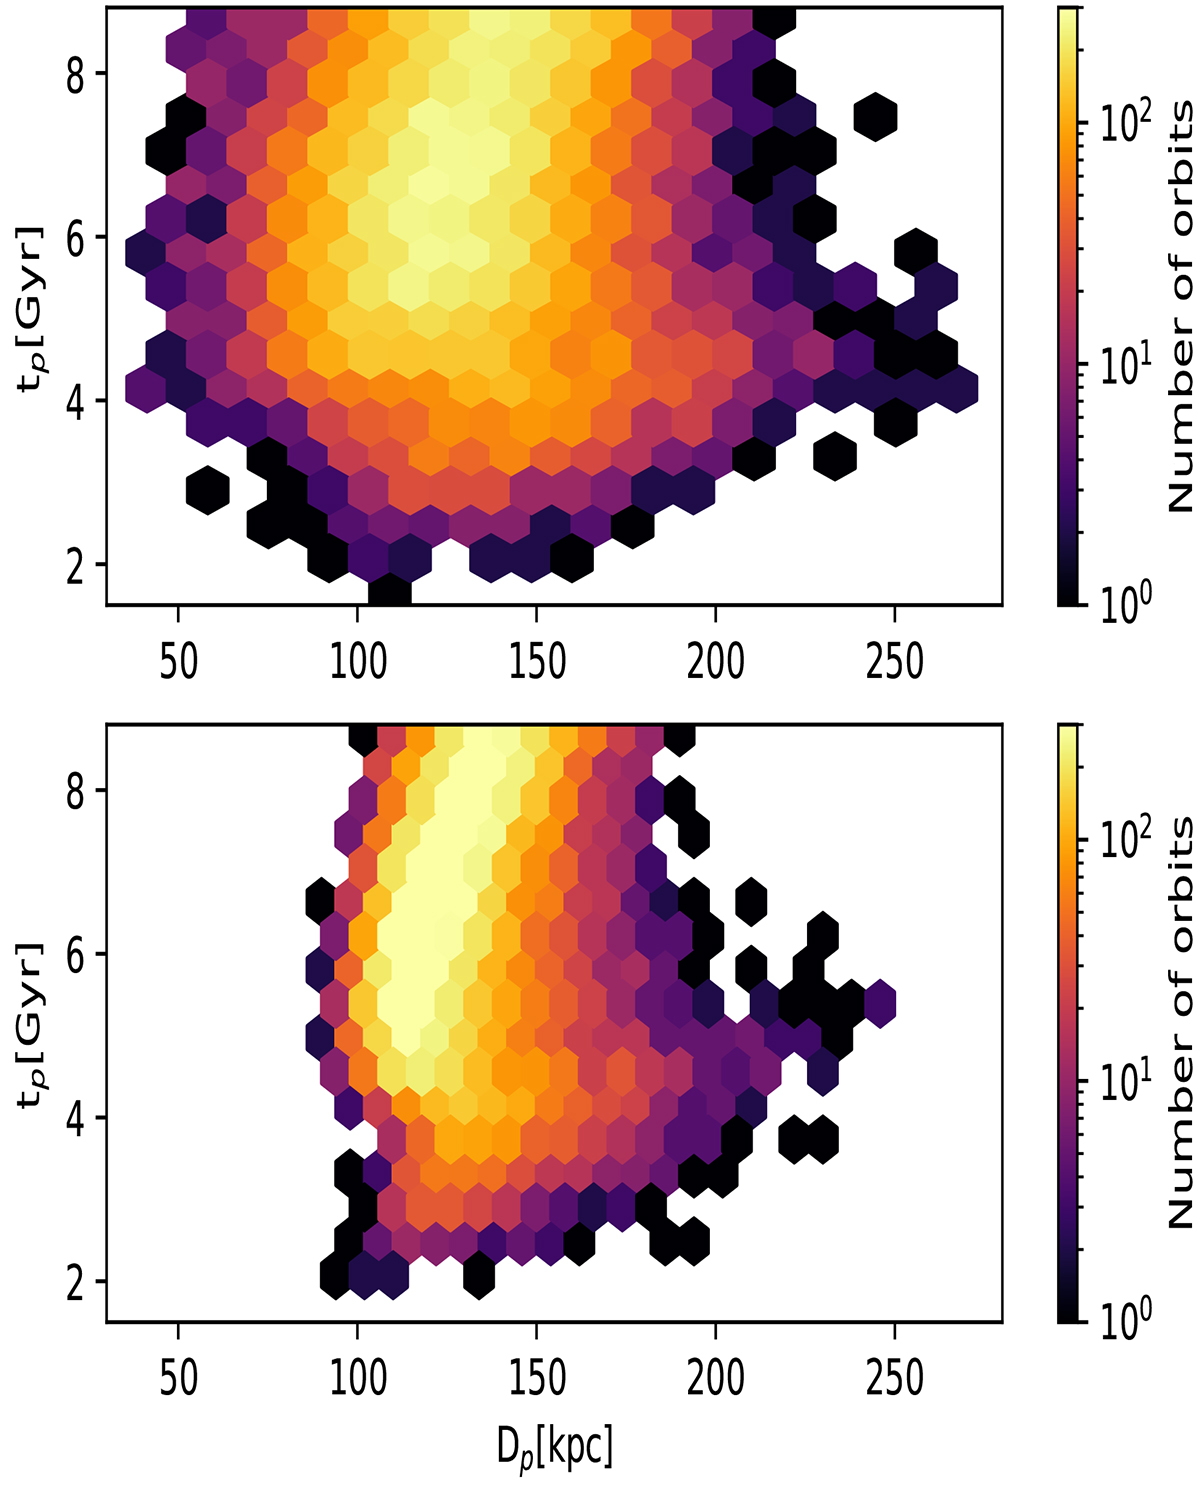
Distribution of pericentre distances Dp and times tp for M33 orbits along which M33 had a close passage around M31. These are shown for today’s distances to M31 and M33 equal to their mean value in the bottom panel while in the top panel distance dispersions around the mean are considered. Regions in the Dp − tp plane are colour coded according to the number of orbital solutions with a close pericentre passage in the past. A total of 100 000 possible orbits have been examined.
Current usage metrics show cumulative count of Article Views (full-text article views including HTML views, PDF and ePub downloads, according to the available data) and Abstracts Views on Vision4Press platform.
Data correspond to usage on the plateform after 2015. The current usage metrics is available 48-96 hours after online publication and is updated daily on week days.
Initial download of the metrics may take a while.