Open Access
Fig. 3.
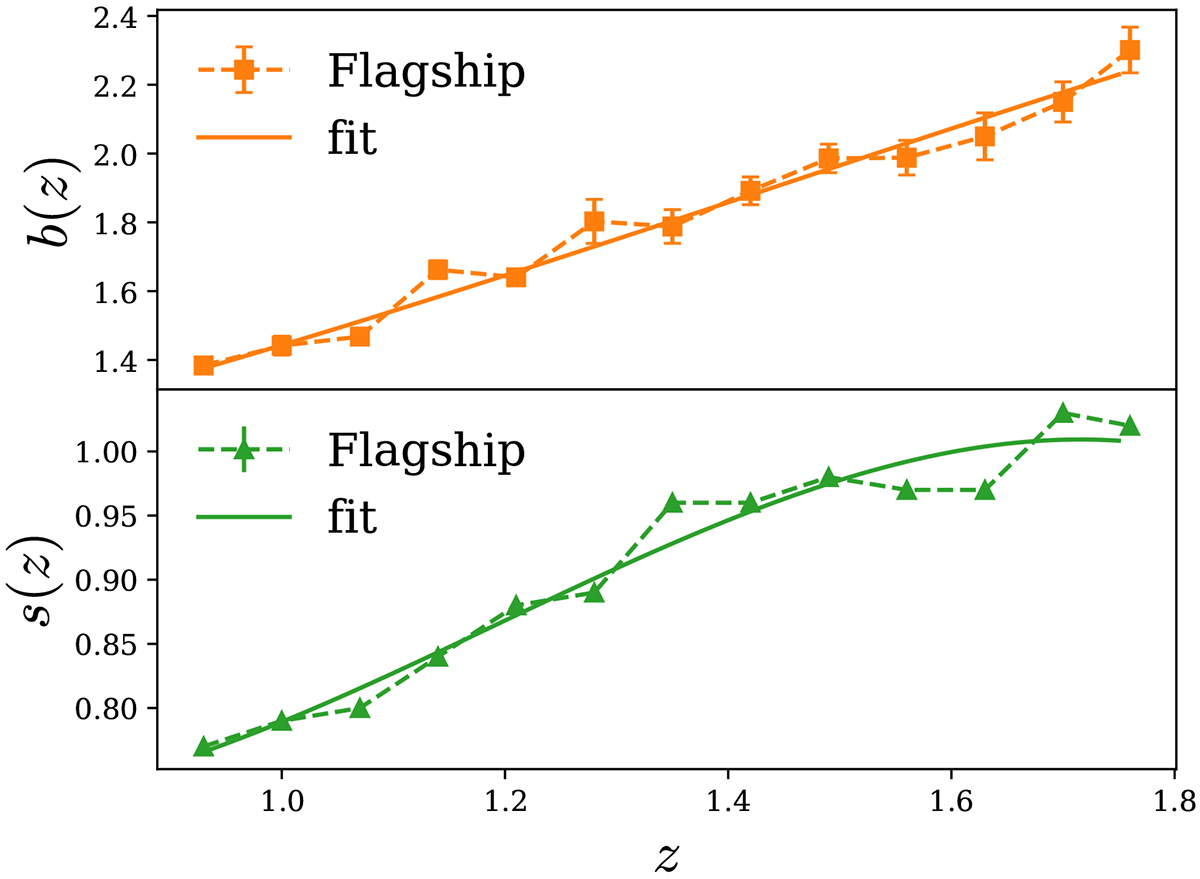
Download original image
Galaxy bias (top panel) and the local count slope (lower panel) with linear interpolation (dashed), as used in our analysis, along with their associated error bars, as well as a polynomial fit (solid). For the exact numerical values of the coefficients, refer to Eq. (B.3).
Current usage metrics show cumulative count of Article Views (full-text article views including HTML views, PDF and ePub downloads, according to the available data) and Abstracts Views on Vision4Press platform.
Data correspond to usage on the plateform after 2015. The current usage metrics is available 48-96 hours after online publication and is updated daily on week days.
Initial download of the metrics may take a while.