Fig. 8
Download original image
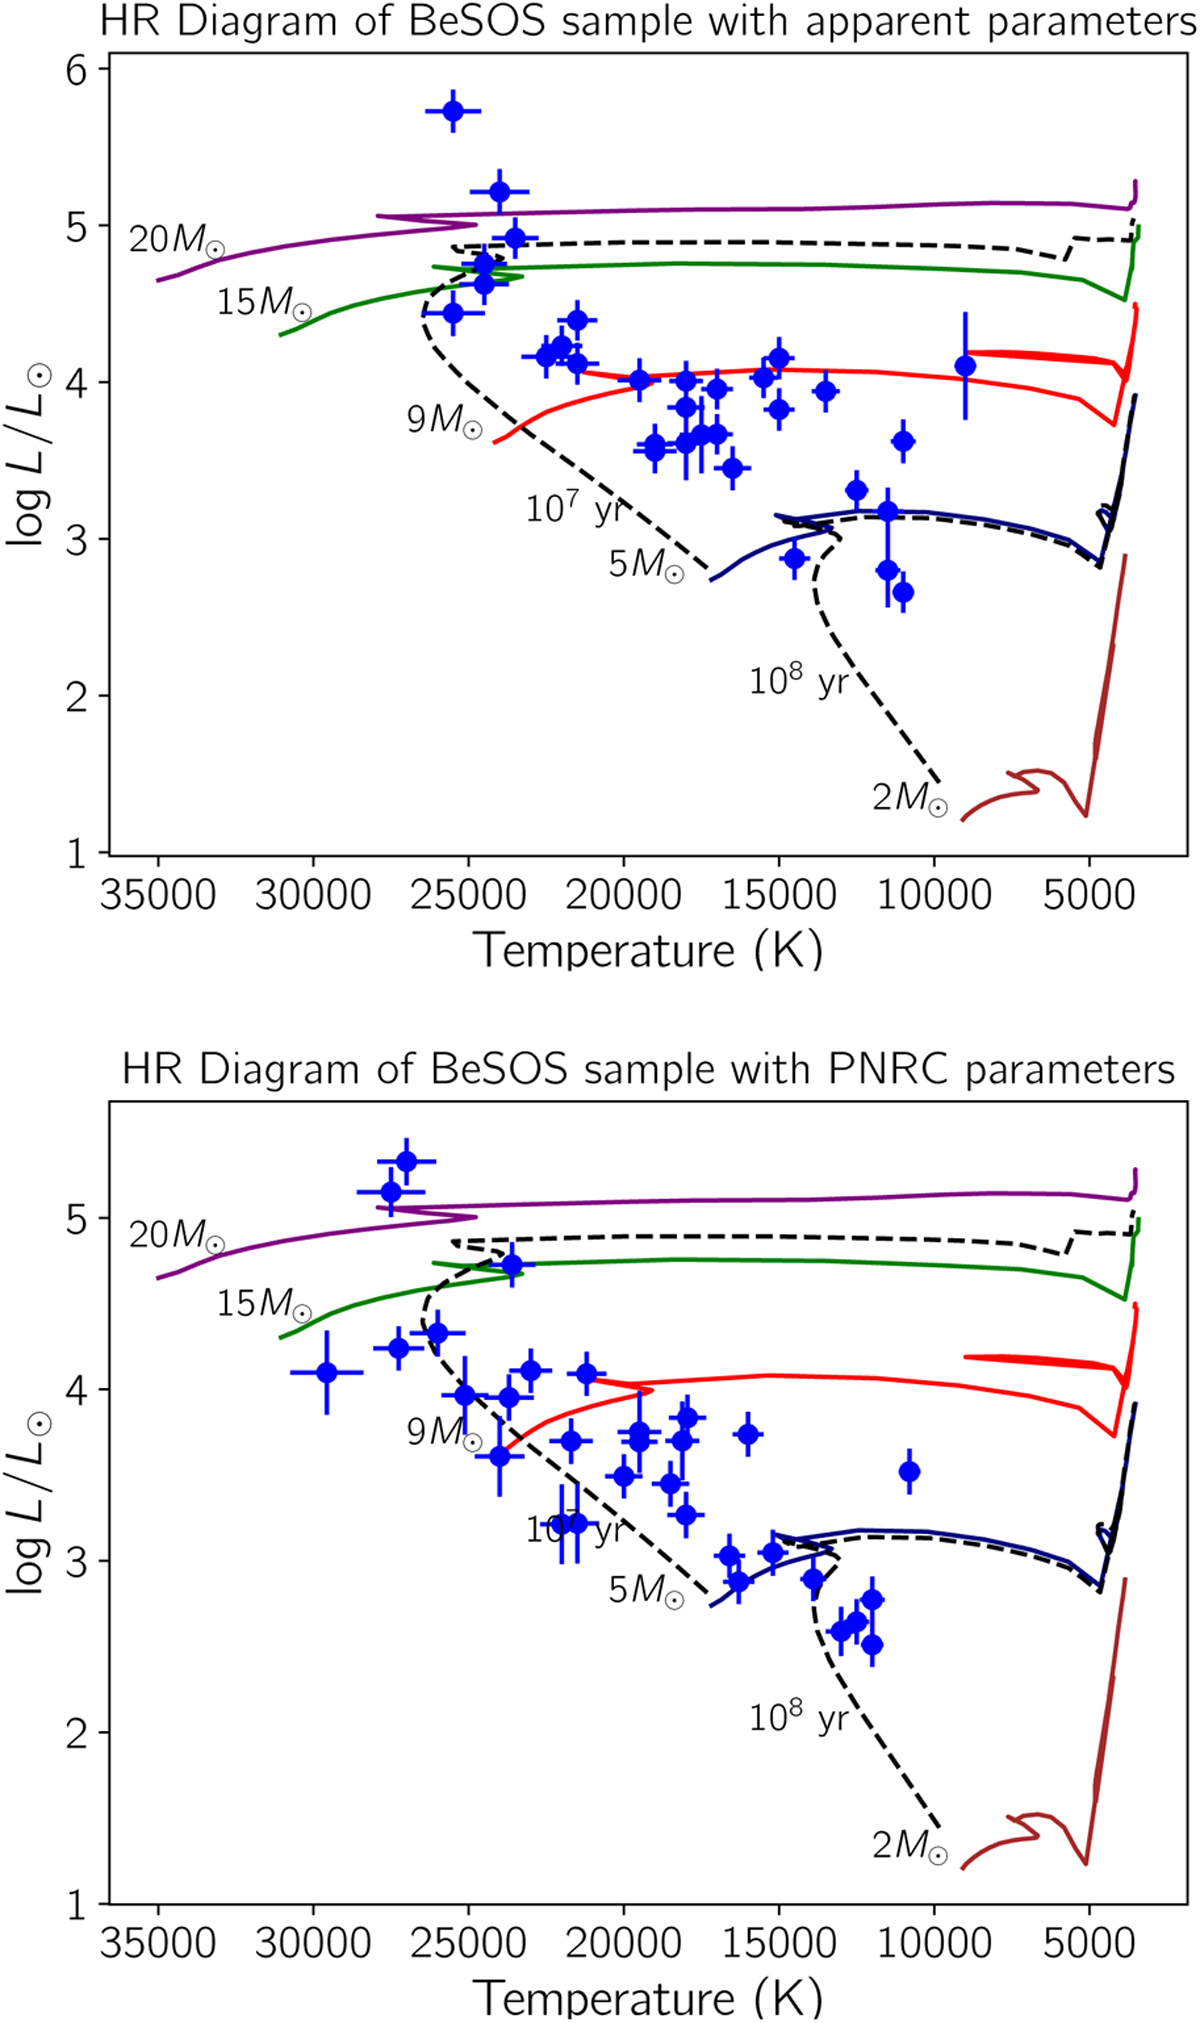
Top panel: The sample of 31 fast-rotating stars (blue dots) represented in the HR diagram shows the apparent Teff and log L/L⊙. parameters. Bottom panel: HR diagram for the same sample, assuming PNRC parameters obtained with the classical von Zeipel model. Black dashed lines represent isochrones with 107 and 108 yr; coloured continuum lines represent evolutionary tracks from 2 M/M⊙ up to 20 M/M⊙. The evolutionary tracks and isochrones were calculated by Schaller et al. (1992) supposing static (non-rotating) internal structure equations.
Current usage metrics show cumulative count of Article Views (full-text article views including HTML views, PDF and ePub downloads, according to the available data) and Abstracts Views on Vision4Press platform.
Data correspond to usage on the plateform after 2015. The current usage metrics is available 48-96 hours after online publication and is updated daily on week days.
Initial download of the metrics may take a while.