Fig. 5
Download original image
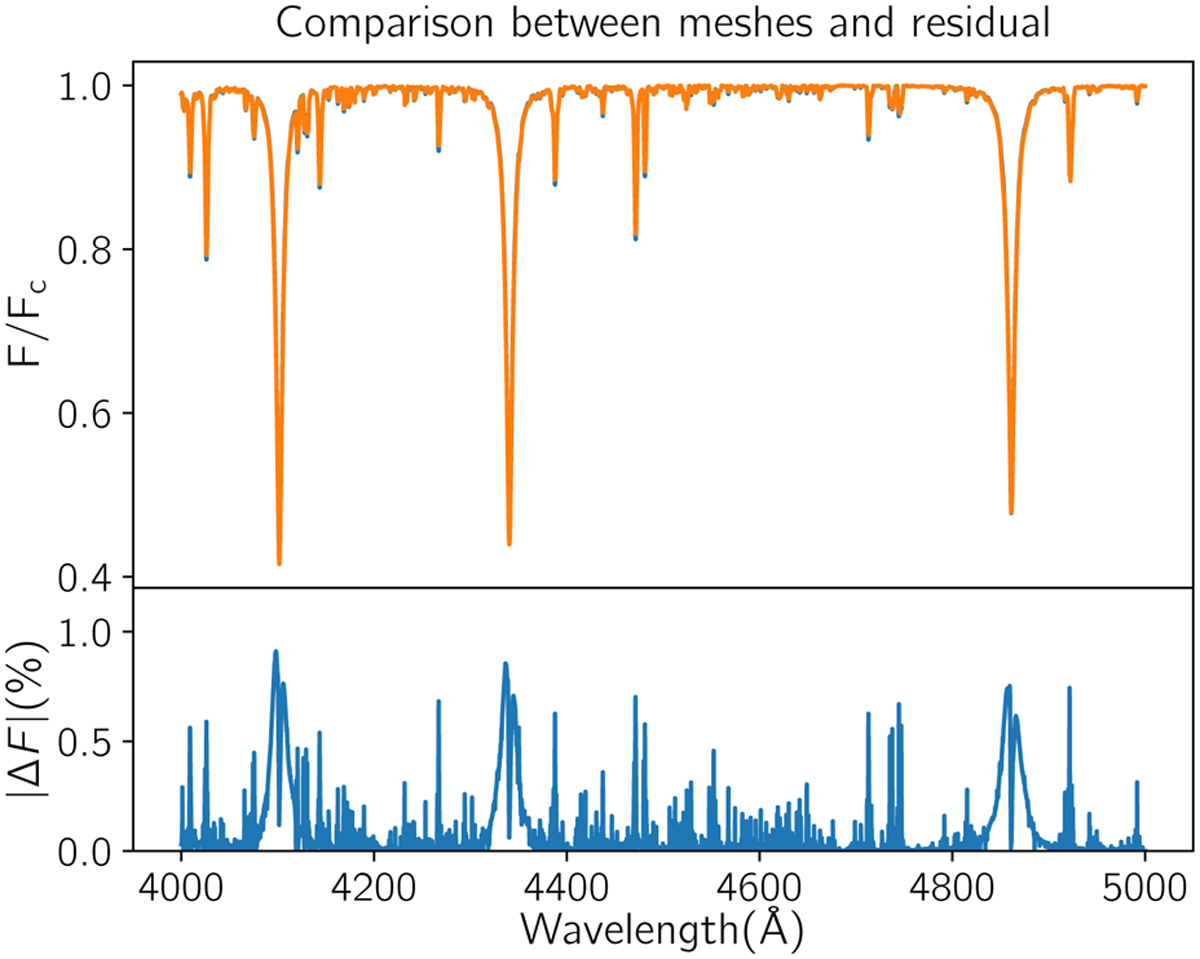
Top panel: Model spectra built with ZPEKTR using the triangular mesh (blue) and the rectangular mesh (orange). The two spectra are almost coincident, and minimal differences are detected only at the line cores of strong lines. Bottom panel: The absolute differences between these two spectra are shown in the bottom plot and are expressed in continuum percentages.
Current usage metrics show cumulative count of Article Views (full-text article views including HTML views, PDF and ePub downloads, according to the available data) and Abstracts Views on Vision4Press platform.
Data correspond to usage on the plateform after 2015. The current usage metrics is available 48-96 hours after online publication and is updated daily on week days.
Initial download of the metrics may take a while.