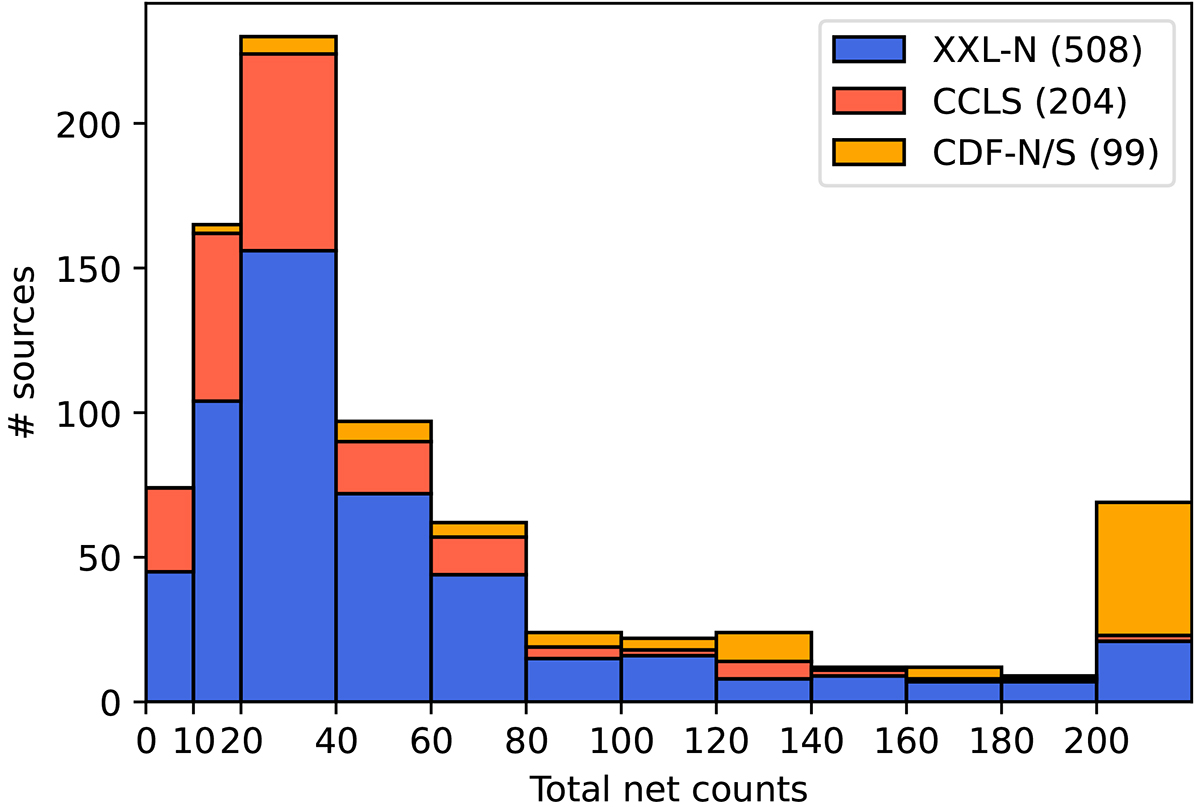
Fig. 3.
Download original image
Distribution of net counts (i.e. total counts minus background counts) for all the sources included in our spectral analysis. For the XMM-Newton spectra the counts correspond to the 0.3–10 keV interval, while for the Chandra spectra the counts correspond to 0.3–8 keV. The last bin contains all sources with more than 200 counts.
Current usage metrics show cumulative count of Article Views (full-text article views including HTML views, PDF and ePub downloads, according to the available data) and Abstracts Views on Vision4Press platform.
Data correspond to usage on the plateform after 2015. The current usage metrics is available 48-96 hours after online publication and is updated daily on week days.
Initial download of the metrics may take a while.