Fig. 11
Download original image
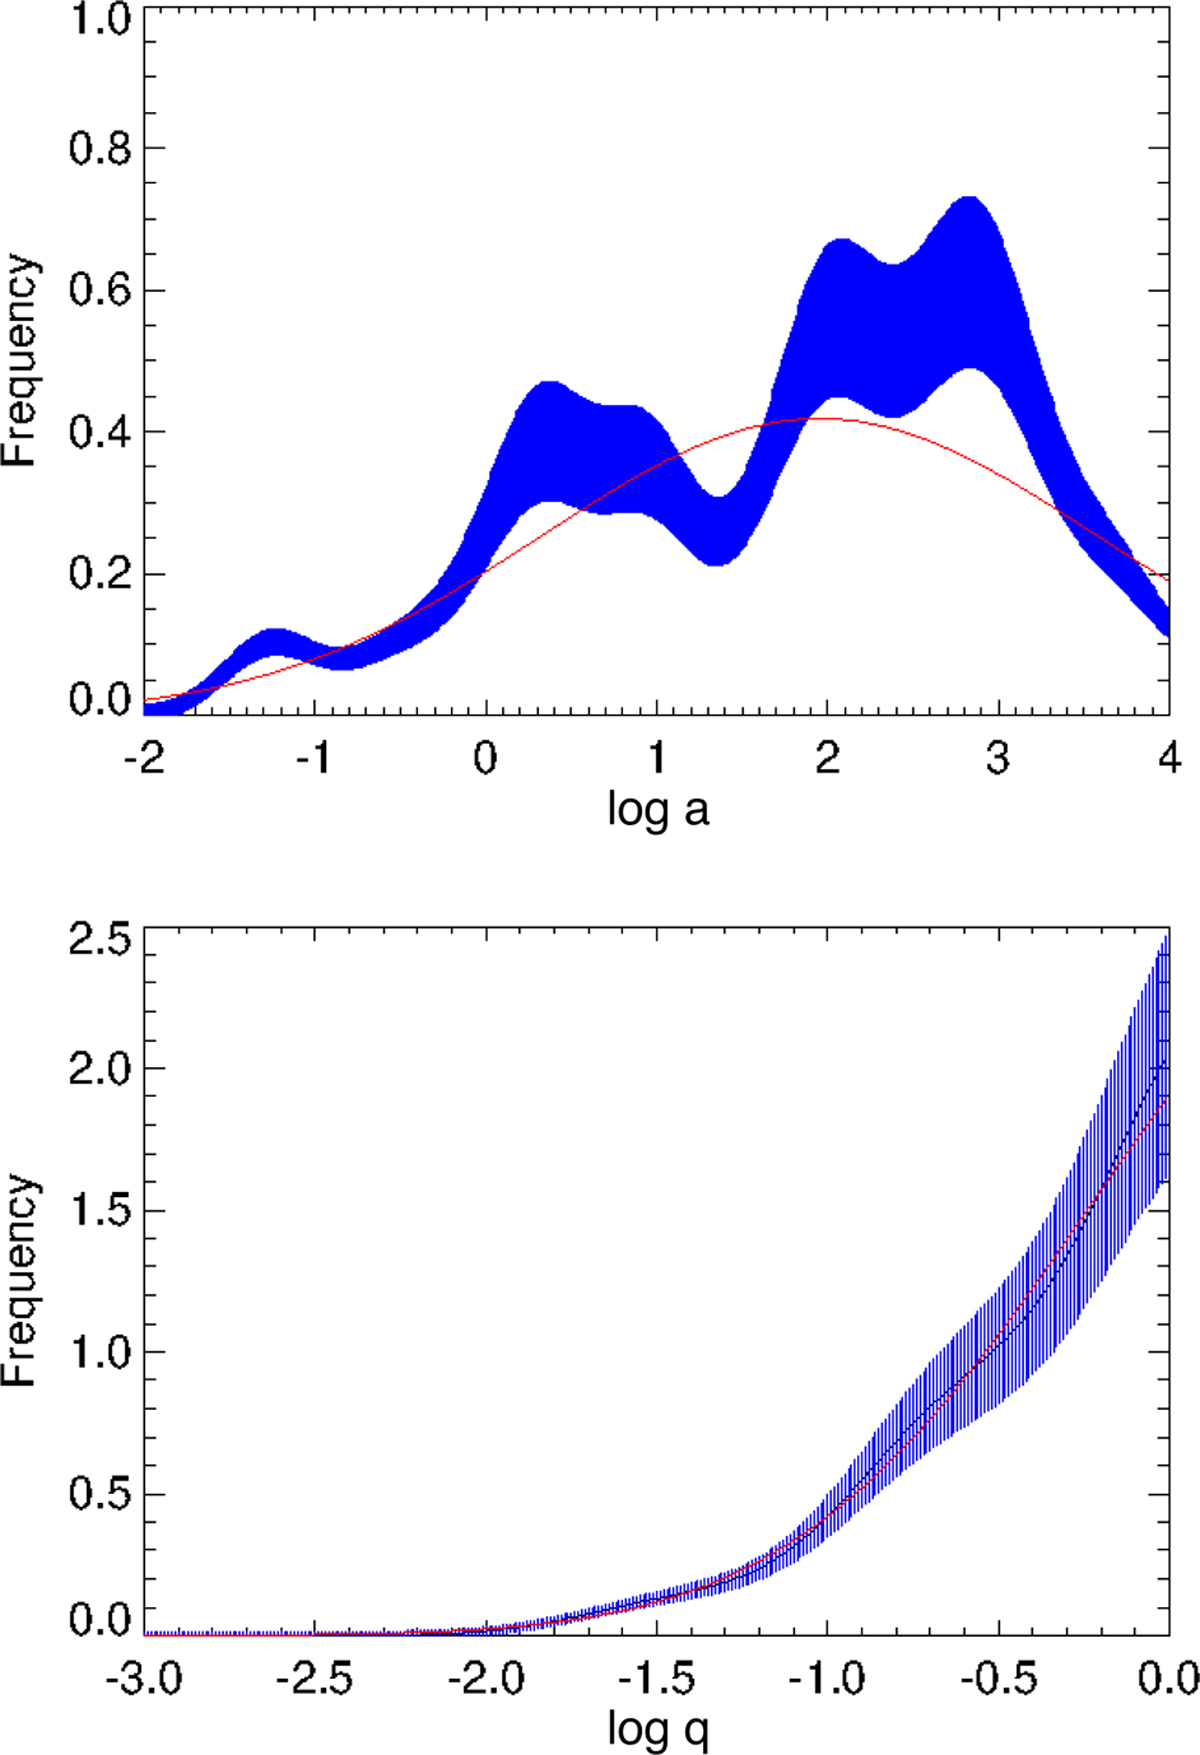
Distribution of companions with mass ratio and semi-major axis. Upper panel: v with log q > −1.08 as a function of the logarithm of the semi-major axis a in au. Lower panel: distribution of companions with 0.5 < log a < 3 as a function of the logarithm of the mass ratio q. The red lines are best fit log-normal through the observed distributions. The shaded area in both panels corresponds to 1σ uncertainty.
Current usage metrics show cumulative count of Article Views (full-text article views including HTML views, PDF and ePub downloads, according to the available data) and Abstracts Views on Vision4Press platform.
Data correspond to usage on the plateform after 2015. The current usage metrics is available 48-96 hours after online publication and is updated daily on week days.
Initial download of the metrics may take a while.