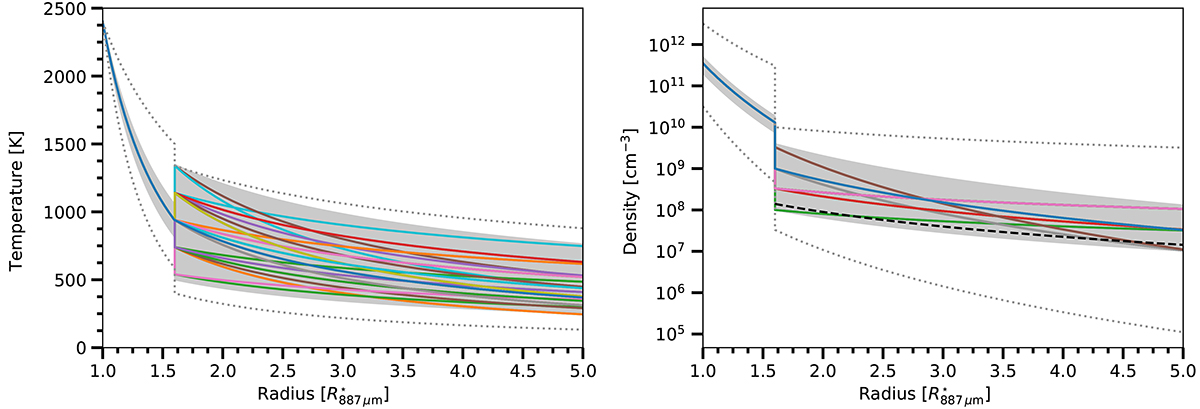
Fig. 9.
Download original image
Models that provide an acceptable fit to the observed CO line profiles (solid lines). The grey region indicates the region over which the values of gas temperature and density as a function of radius can vary in the context of our model and still fit the data. The dashed black line indicates the density of an outflow with a constant velocity of 5.5 km s−1 and a mass-loss rate of 10−7 M⊙ yr−1. The dotted lines represent the limits of the range explored in the grid calculations for the temperature and density profiles.
Current usage metrics show cumulative count of Article Views (full-text article views including HTML views, PDF and ePub downloads, according to the available data) and Abstracts Views on Vision4Press platform.
Data correspond to usage on the plateform after 2015. The current usage metrics is available 48-96 hours after online publication and is updated daily on week days.
Initial download of the metrics may take a while.