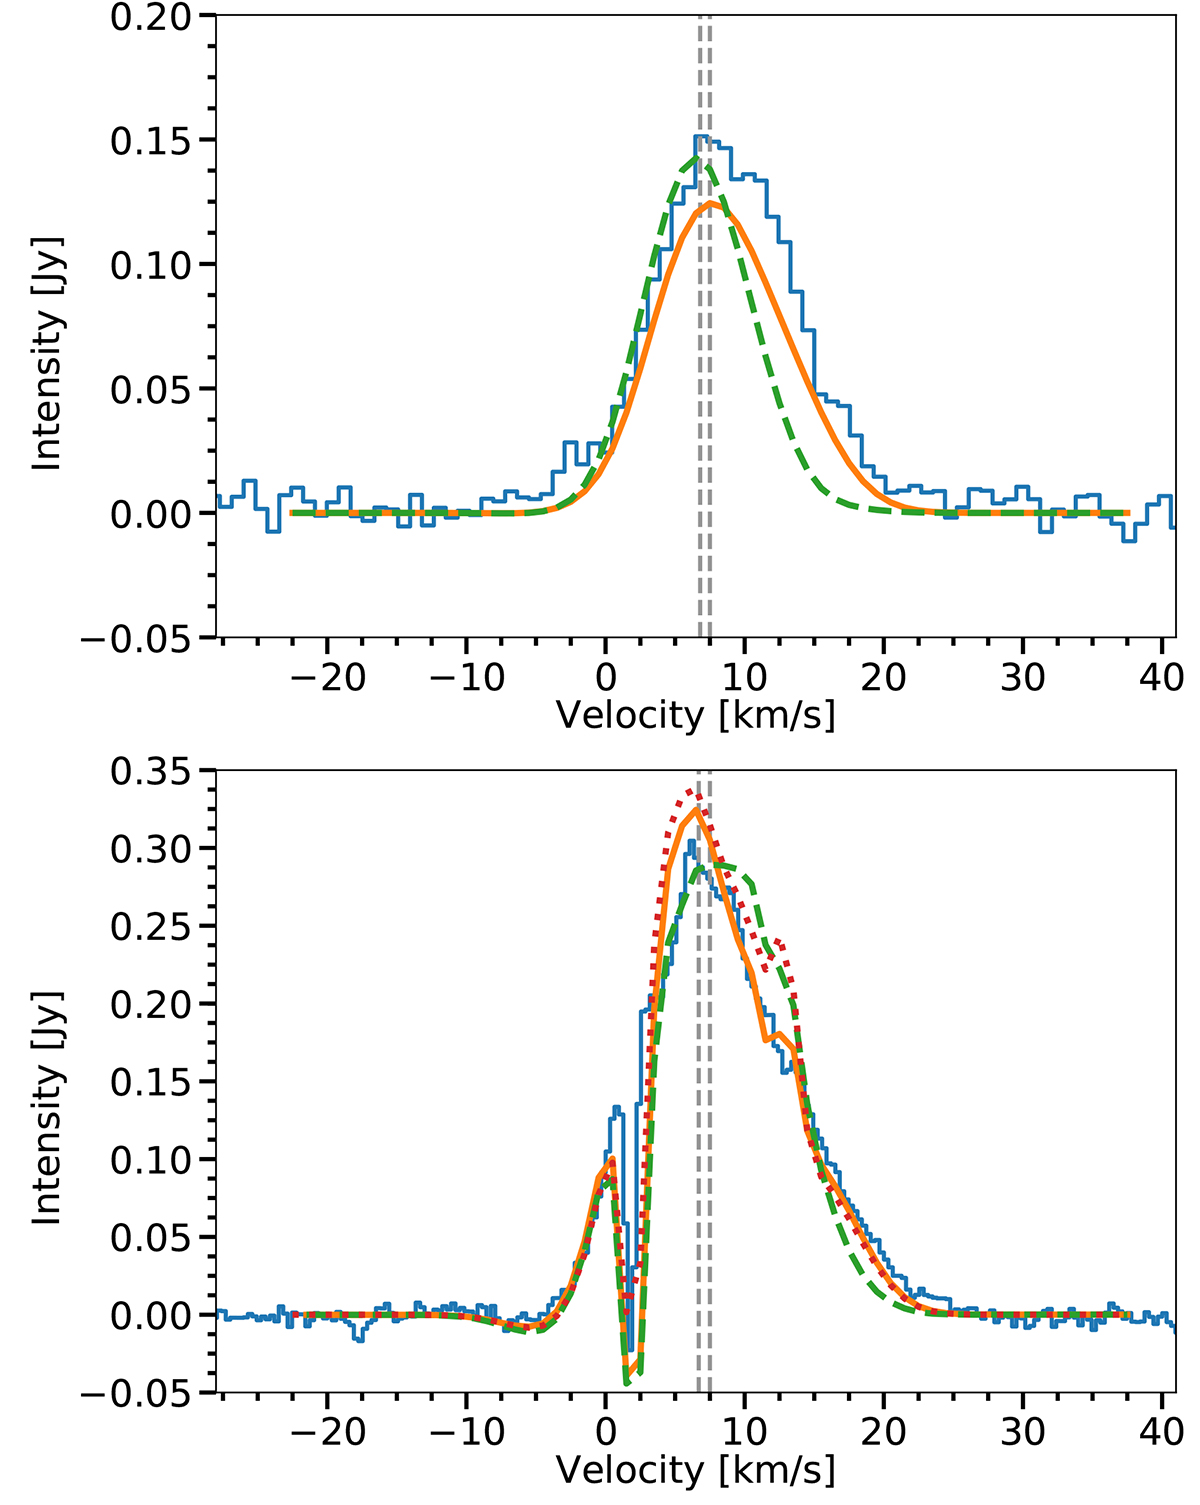
Fig. 8.
Download original image
Comparison between the CO v = 1, J = 3 − 2 (upper panel) and CO v = 0, J = 2 − 1 (lower panel) line profiles of the model with symmetric radial velocity field (dashed green line) and the model with an outflow with the modifications to the velocity field discussed in Sects. 6.4.1 and 6.4.2 (solid yellow line). The observed spectra are shown by the blue histograms and the possible values of the systemic velocity are indicated by the vertical dashed grey lines. We adopted a systemic velocity of 7.4 km s−1 when shifting the model to fit the data. All spectra were extracted from an aperture with 240 mas diameter centred on the star. In the lower panel, the spectrum of the model with the modifications to the velocity field is shown without simulating of observation by the ALMA array (dotted red line). In this case, only smoothing to the beam resolution was carried out. Hence, the comparison between the dotted red line and the solid yellow line shows how much flux is being resolved out by simulating the interferometric observations.
Current usage metrics show cumulative count of Article Views (full-text article views including HTML views, PDF and ePub downloads, according to the available data) and Abstracts Views on Vision4Press platform.
Data correspond to usage on the plateform after 2015. The current usage metrics is available 48-96 hours after online publication and is updated daily on week days.
Initial download of the metrics may take a while.