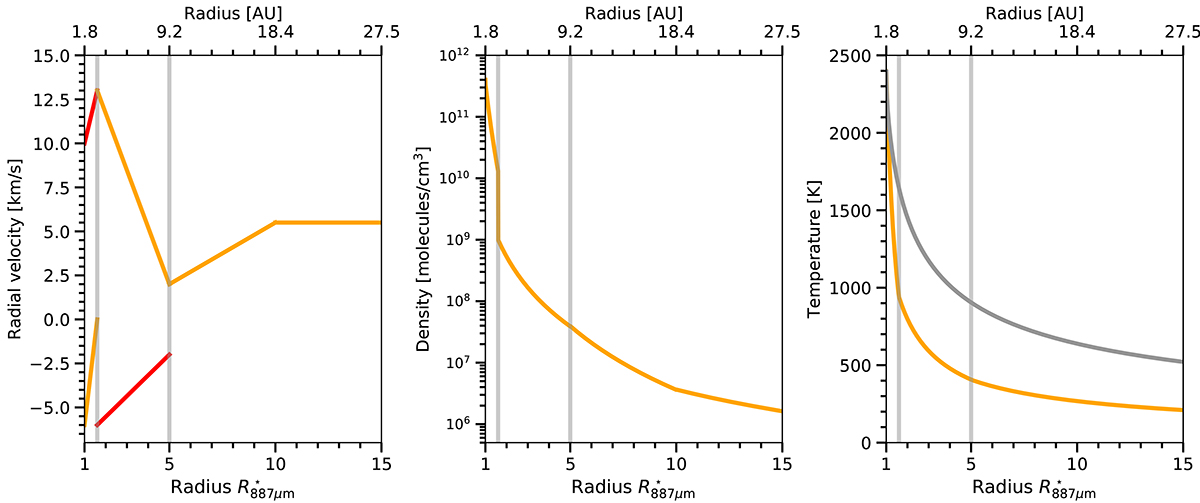
Fig. 7.
Download original image
Physical structure of the best model shown in Fig. 2 and presented in Sect. 6. The orange lines show the profiles of radial velocity (left panel), density (middle panel), and temperature (right panel) in the symmetric model with rotation and the red lines show the modifications introduced in the velocity field in the far-side hemisphere to improve the fit to the line profiles. The tangential (rotational) velocity is not indicated in these plots. The grey line in the temperature panel shows a grey atmosphere temperature profile. The vertical light grey lines mark the transition between the inner and intermediate regions and between the intermediate and outer regions in the model (as shown in Table 1).
Current usage metrics show cumulative count of Article Views (full-text article views including HTML views, PDF and ePub downloads, according to the available data) and Abstracts Views on Vision4Press platform.
Data correspond to usage on the plateform after 2015. The current usage metrics is available 48-96 hours after online publication and is updated daily on week days.
Initial download of the metrics may take a while.