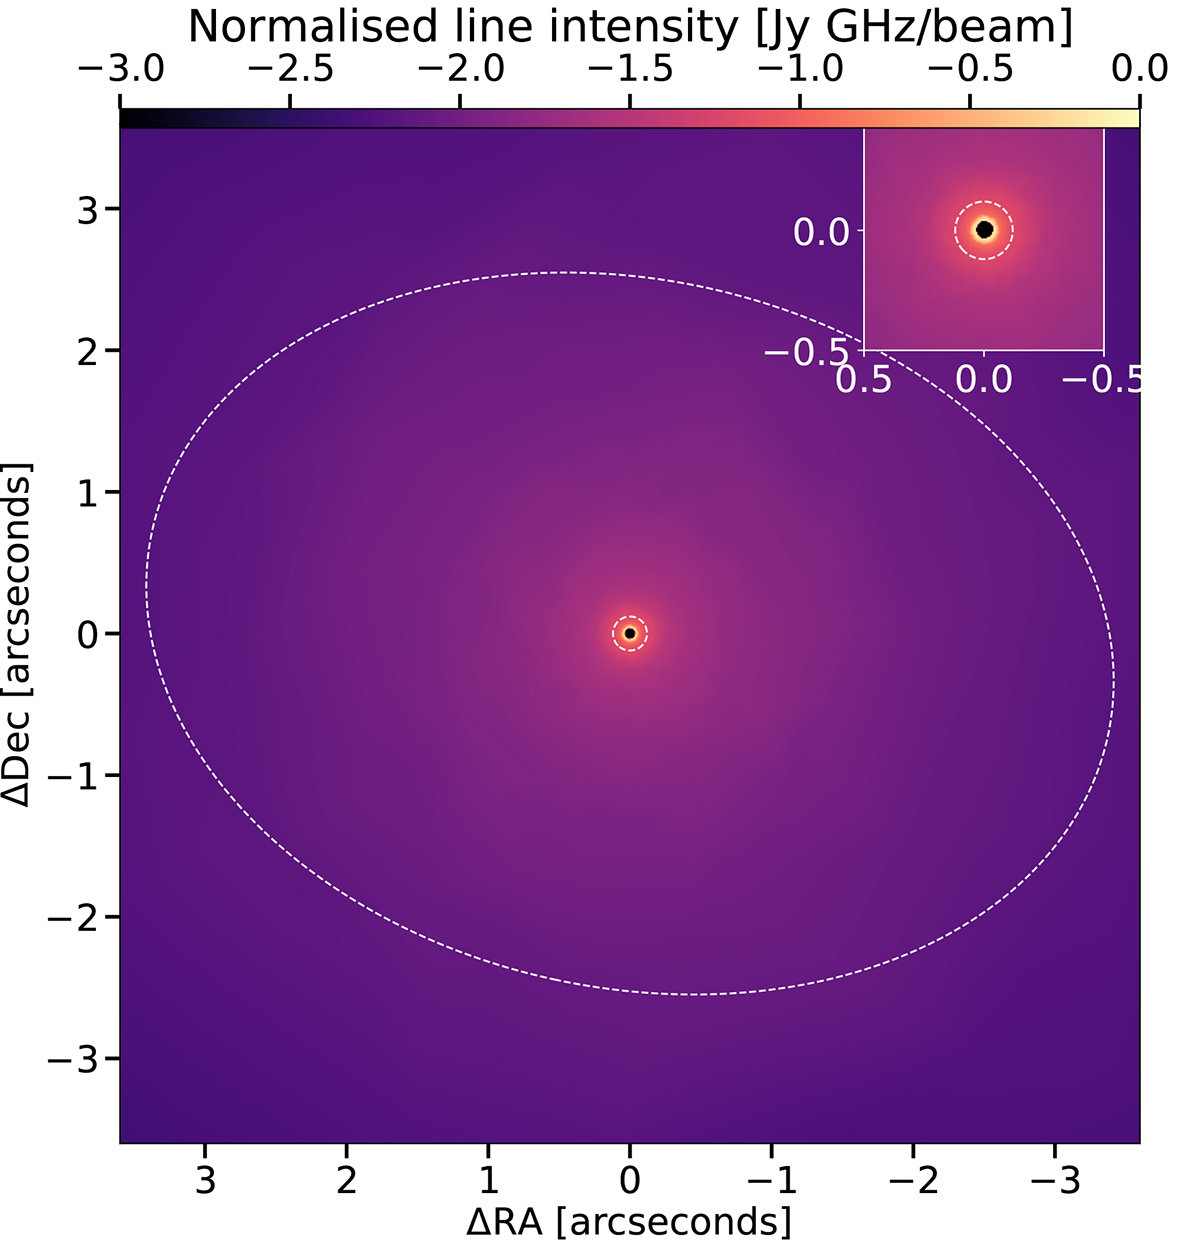
Fig. 6.
Download original image
Brightness distribution of the frequency-integrated CO v = 0, J = 2 − 1 line in our model. The colour map shows the base-10 logarithm of the intensity (per pixel) normalised to the peak value in the image. In the pixels towards the star, where negative values lead to undefined logarithms, we arbitrarily set very negative values. The inset shows a zoom towards the inner region. The dashed contours mark the largest aperture from where we extract spectra for our inner-envelope model (inner contour) and the size of the ACA beam (outer contour). The brightness decreases by about a factor of ten between these two contours.
Current usage metrics show cumulative count of Article Views (full-text article views including HTML views, PDF and ePub downloads, according to the available data) and Abstracts Views on Vision4Press platform.
Data correspond to usage on the plateform after 2015. The current usage metrics is available 48-96 hours after online publication and is updated daily on week days.
Initial download of the metrics may take a while.