Fig. 4.
Download original image
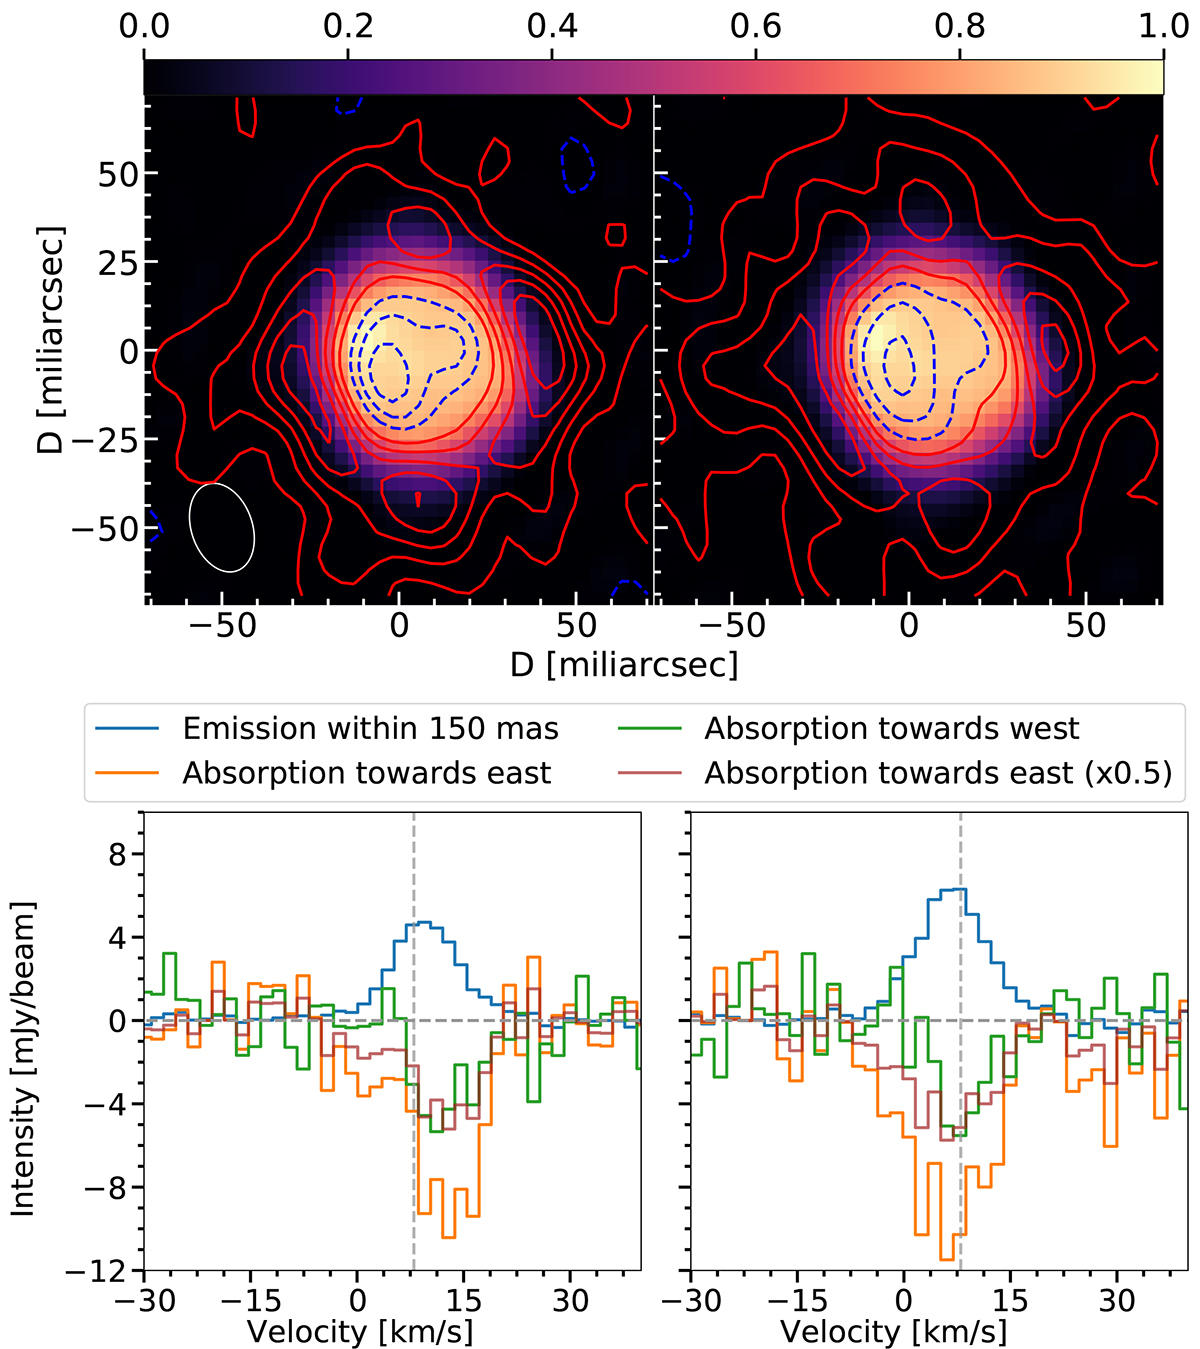
Emission region and spectra of the CO v = 1, J = 3 − 2 (left panels) and 13CO v = 0, J = 3 − 2 (right panels) lines. Upper panels: normalised stellar continuum emission observed by ALMA in Band 7 (colour maps) compared to the line emission (red contours) and absorption (dashed blue contours). The positive (red) contours are drawn at 1, 2, 3, 4, and 5 mJy × GHz beam−1 for both lines. The negative (blue) contours are drawn at −2.5, −1.5, and −0.5 mJy × GHz beam−1 for the CO v = 1, J = 3 − 2 line and at −3.6, −2, and −0.4 mJy × GHz beam−1 for the 13CO v = 0, J = 3 − 2 line. The root-mean-square noise is 0.4 mJy × GHz beam−1 in both images. Lower panels: spectra extracted towards the absorption peak to the east of the star (yellow histogram) compared to that observed to the west (green histogram) and to the emission from an aperture with diameter 150 mas (blue histogram). The absorption profile to the east is also shown scaled by a factor of 0.5 in comparison (brown histogram). The systemic velocity determined from the fit to the absorption line obtained in Sect. 4.2.2 (7.4 km s−1) is shown by the vertical dashed lines.
Current usage metrics show cumulative count of Article Views (full-text article views including HTML views, PDF and ePub downloads, according to the available data) and Abstracts Views on Vision4Press platform.
Data correspond to usage on the plateform after 2015. The current usage metrics is available 48-96 hours after online publication and is updated daily on week days.
Initial download of the metrics may take a while.