Fig. 3.
Download original image
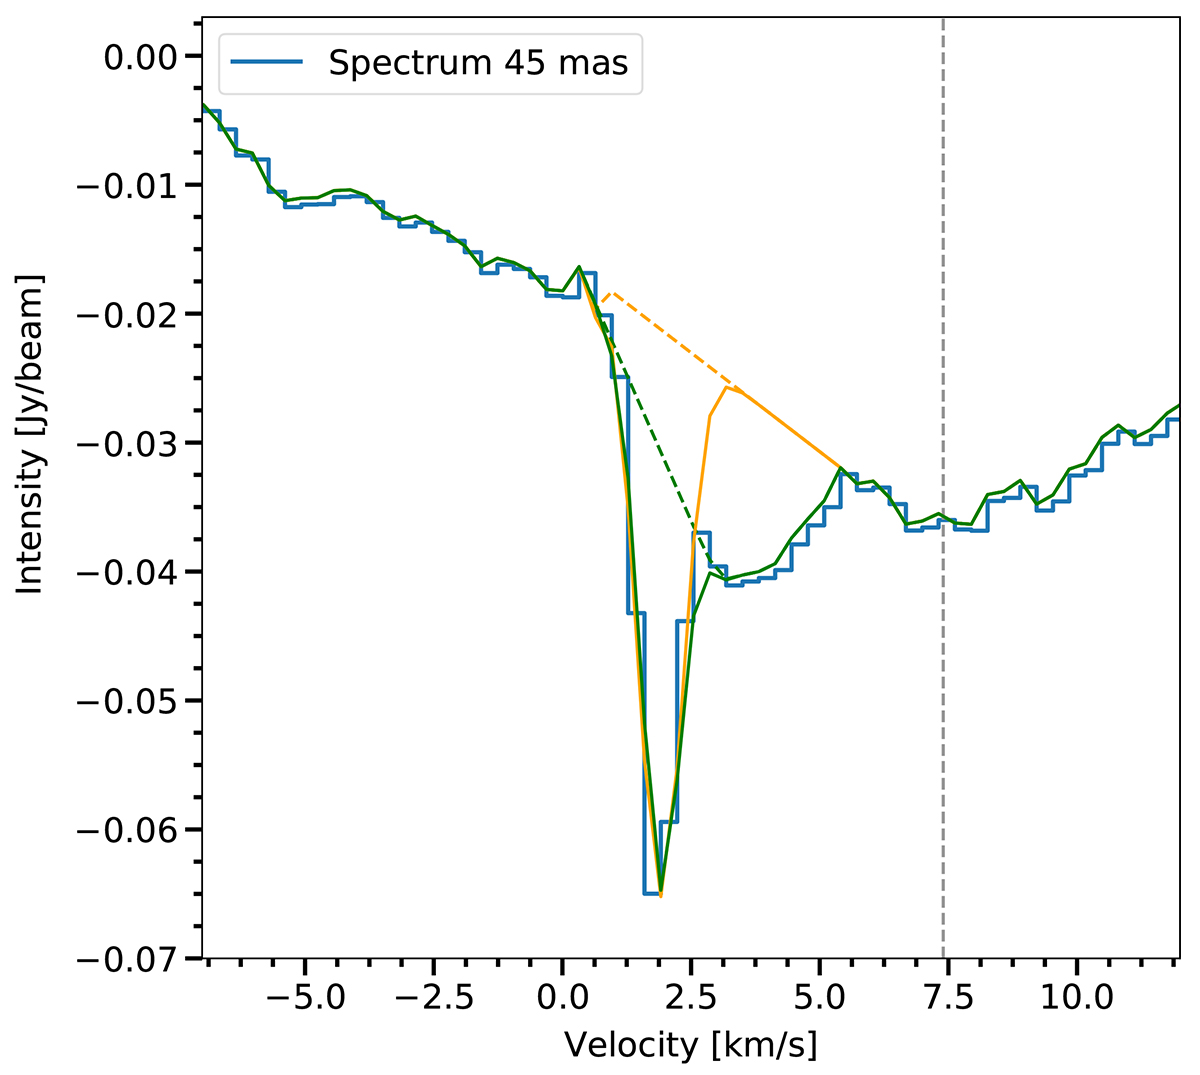
Spectrum of the CO v = 0, J = 2 − 1 line extracted from an aperture with a diameter of 45 mas towards the star (blue histogram). Two fits to the sharp absorption feature produced by the large-scale outflow are shown by the yellow and green lines. The dashed lines along the fit show our assumption for the underlying atmospheric absorption line on top of which the sharp feature is added. The vertical dashed line indicates the systemic velocity (∼7.4 km s−1) inferred from the adopted expansion velocity of 5.5 km s−1.
Current usage metrics show cumulative count of Article Views (full-text article views including HTML views, PDF and ePub downloads, according to the available data) and Abstracts Views on Vision4Press platform.
Data correspond to usage on the plateform after 2015. The current usage metrics is available 48-96 hours after online publication and is updated daily on week days.
Initial download of the metrics may take a while.