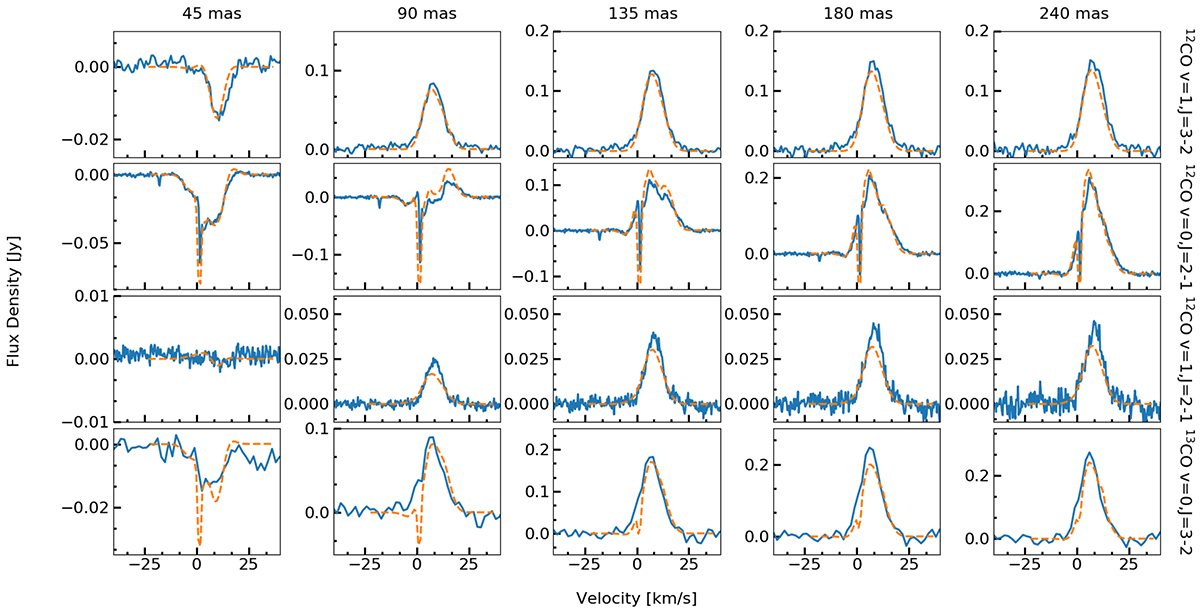
Fig. 2.
Download original image
Extracted CO spectra. The panels show extracted CO spectra (blue histograms) and the best-fit model presented in Sect. 6. The model was shifted using a systemic velocity of 7.4 km s−1. From left to right, we present spectra extracted from apertures with diameters of 45, 90, 135, 180, and 240 mas. From top to bottom, the lines shown are CO v = 1, J = 3 − 2, CO v = 0, J = 2 − 1, CO v = 1, J = 2 − 1, and 13CO v = 0, J = 3 − 2.
Current usage metrics show cumulative count of Article Views (full-text article views including HTML views, PDF and ePub downloads, according to the available data) and Abstracts Views on Vision4Press platform.
Data correspond to usage on the plateform after 2015. The current usage metrics is available 48-96 hours after online publication and is updated daily on week days.
Initial download of the metrics may take a while.