Fig. A.1.
Download original image
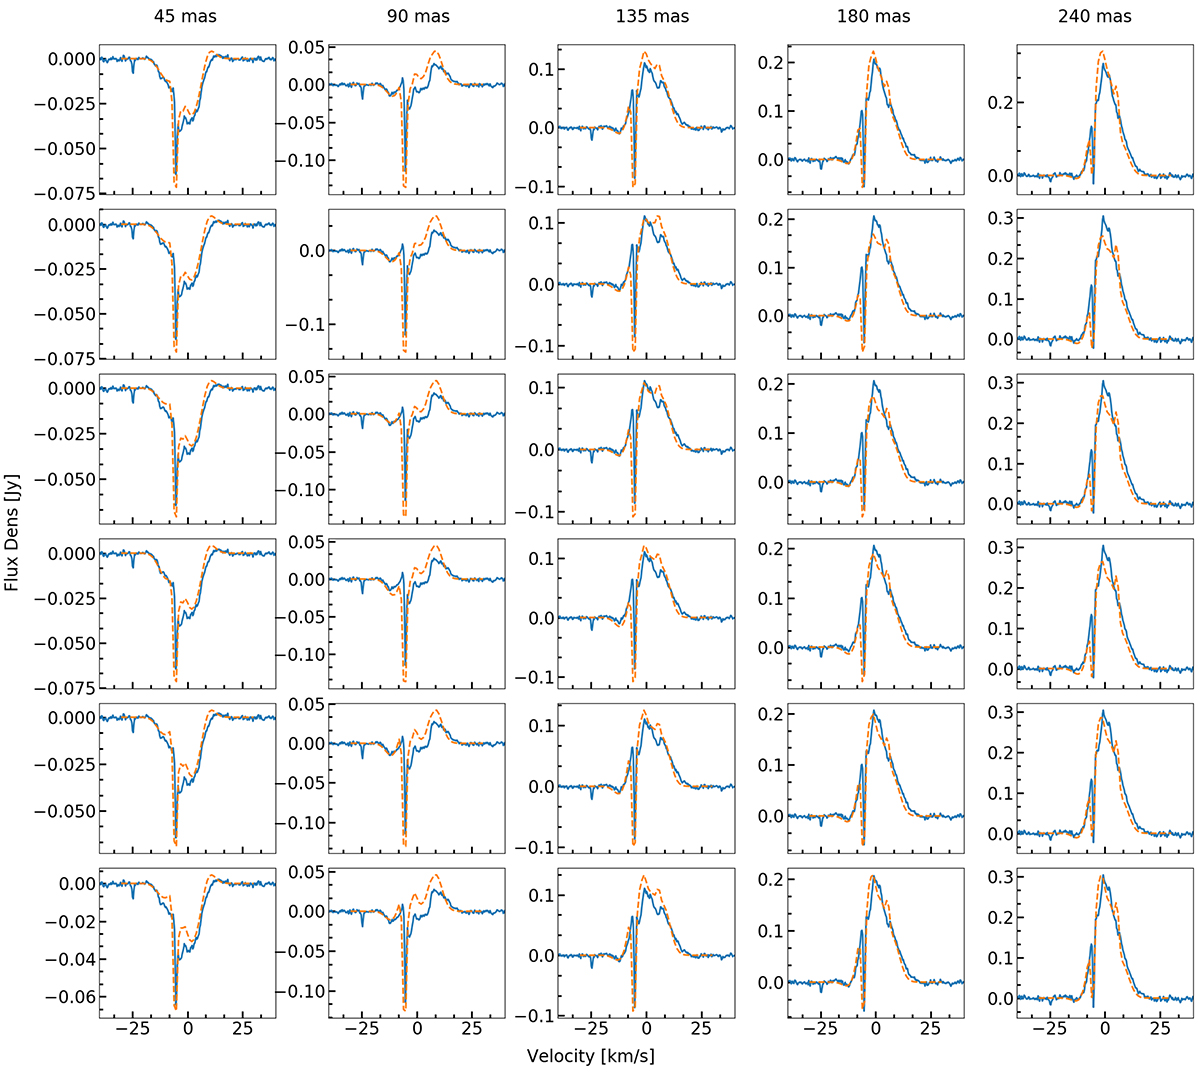
Top-ranked models from our residual minimisation and considered good fits upon inspection of the line profiles. Observed spectra of the CO v = 0, J = 2 − 1 line extracted from five different aperture sizes is shown by the blue histogram. From left to right, the apertures diameters are 45 mas, 90 mas, 135 mas, 180 mas, and 240 mas. The dashed yellow lines represent the models. The first row shows our best model from Section 6.2, while models from the grid considered acceptable are shown in the following rows.
Current usage metrics show cumulative count of Article Views (full-text article views including HTML views, PDF and ePub downloads, according to the available data) and Abstracts Views on Vision4Press platform.
Data correspond to usage on the plateform after 2015. The current usage metrics is available 48-96 hours after online publication and is updated daily on week days.
Initial download of the metrics may take a while.