Fig. 12.
Download original image
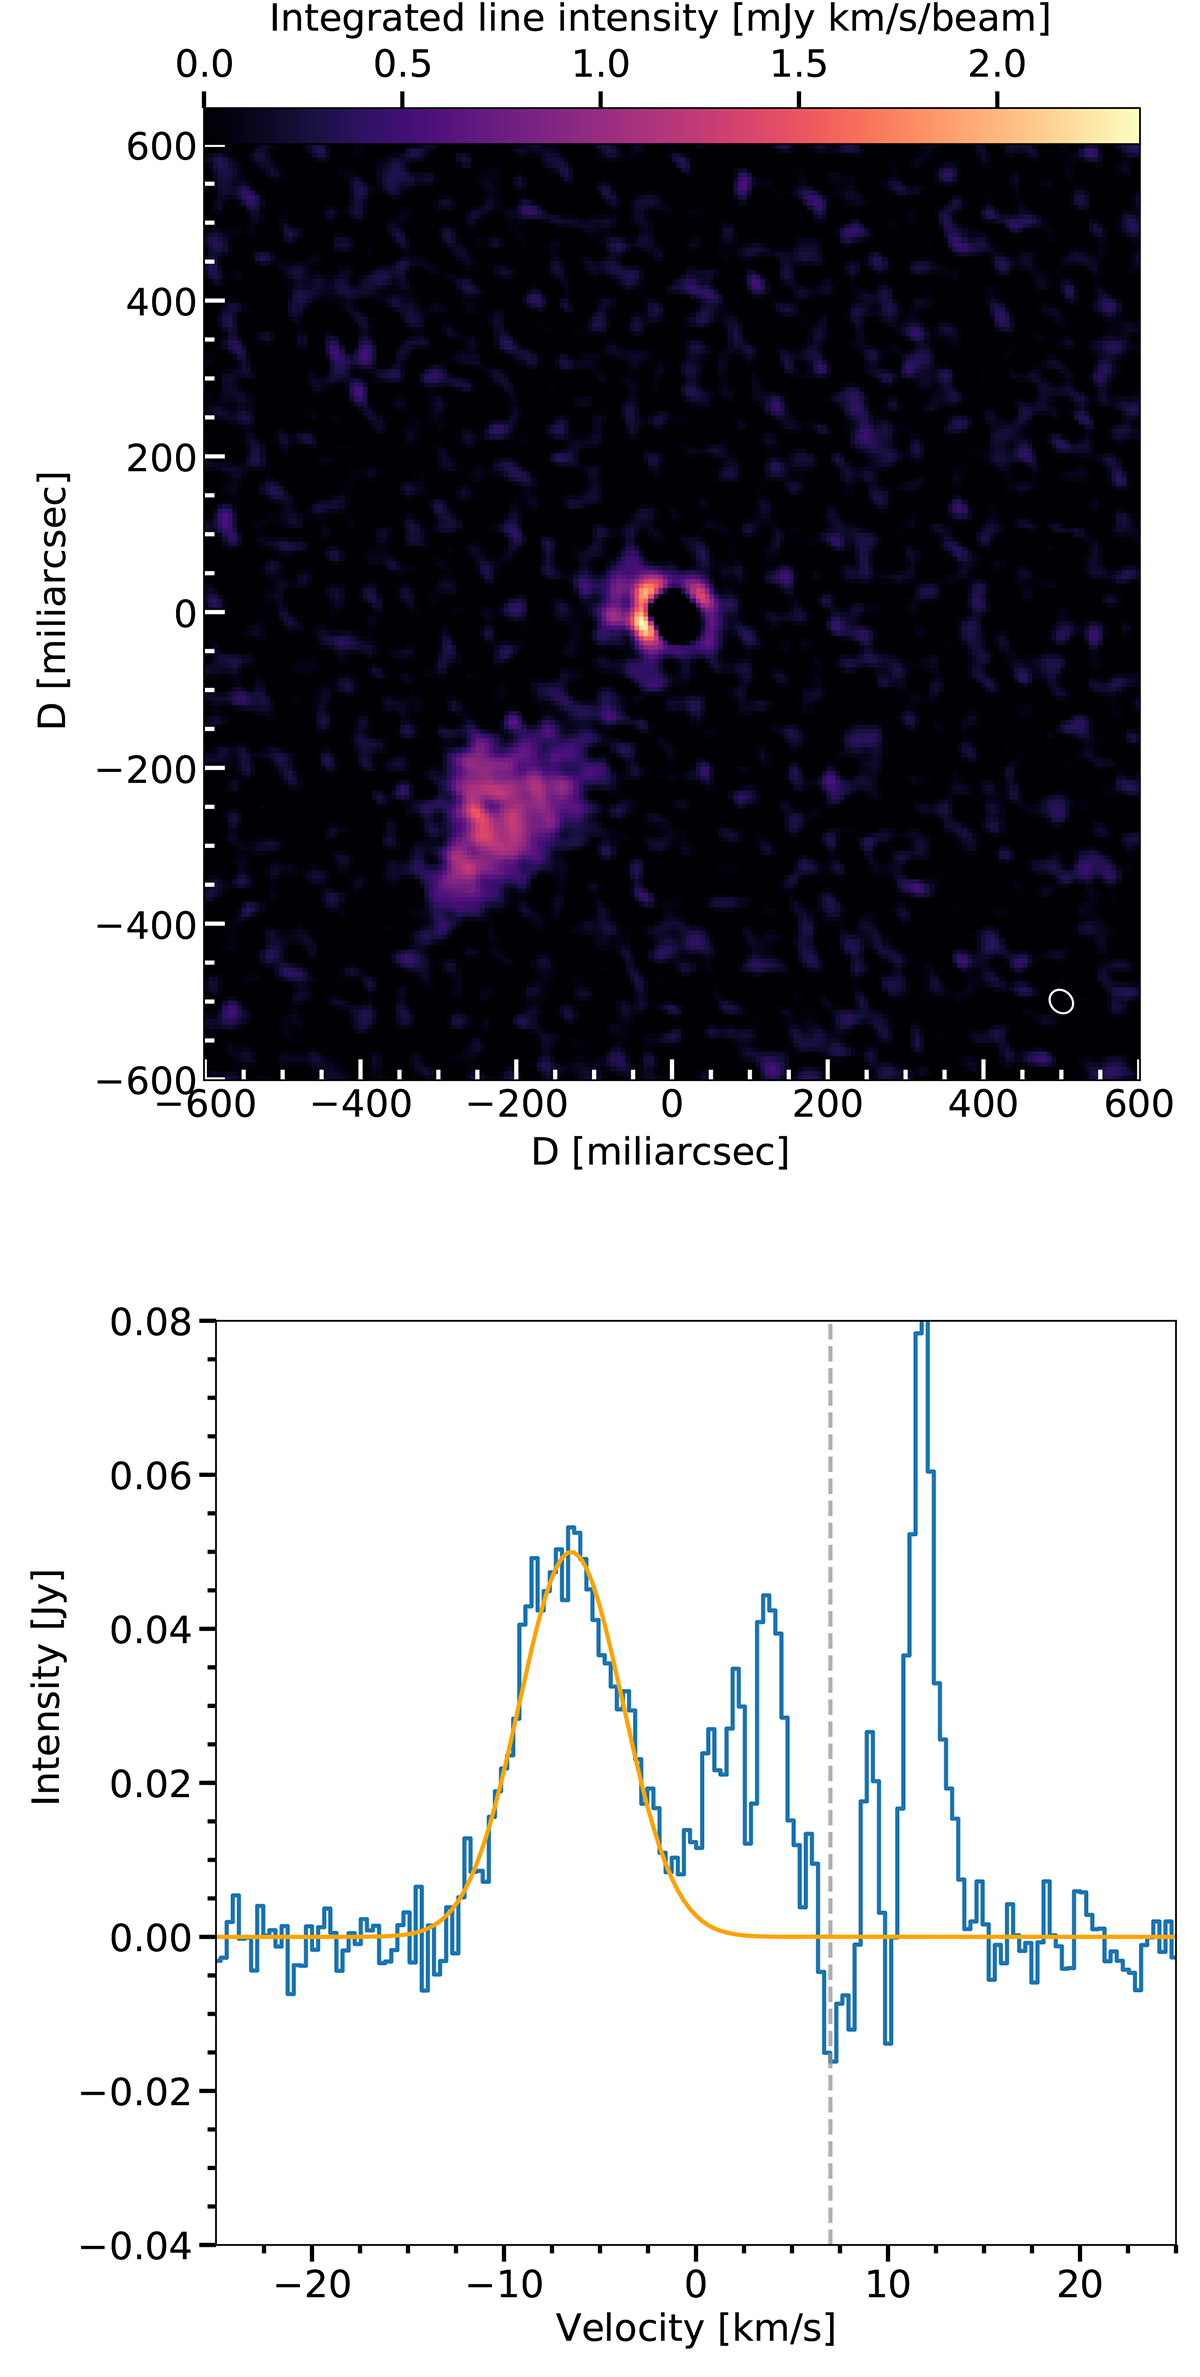
Observations of the high-velocity clump. Upper panel: integrated line intensity (moment-zero) map of the CO v = 0, J = 2 − 1 emission integrated in velocity between −14 and −1 km s−1. The white ellipse in the lower right corner shows the size at half maximum of the ALMA gaussian beam. Lower panel: spectrum extracted towards the region defined by the blob in the upper panel (blue histogram). A gaussian fit to the emission associated with the blob is shown in the solid orange line. For reference, the vertical dashed grey line indicates one of the values for the systemic velocity derived by us (7.4 km s−1).
Current usage metrics show cumulative count of Article Views (full-text article views including HTML views, PDF and ePub downloads, according to the available data) and Abstracts Views on Vision4Press platform.
Data correspond to usage on the plateform after 2015. The current usage metrics is available 48-96 hours after online publication and is updated daily on week days.
Initial download of the metrics may take a while.