Fig. 10.
Download original image
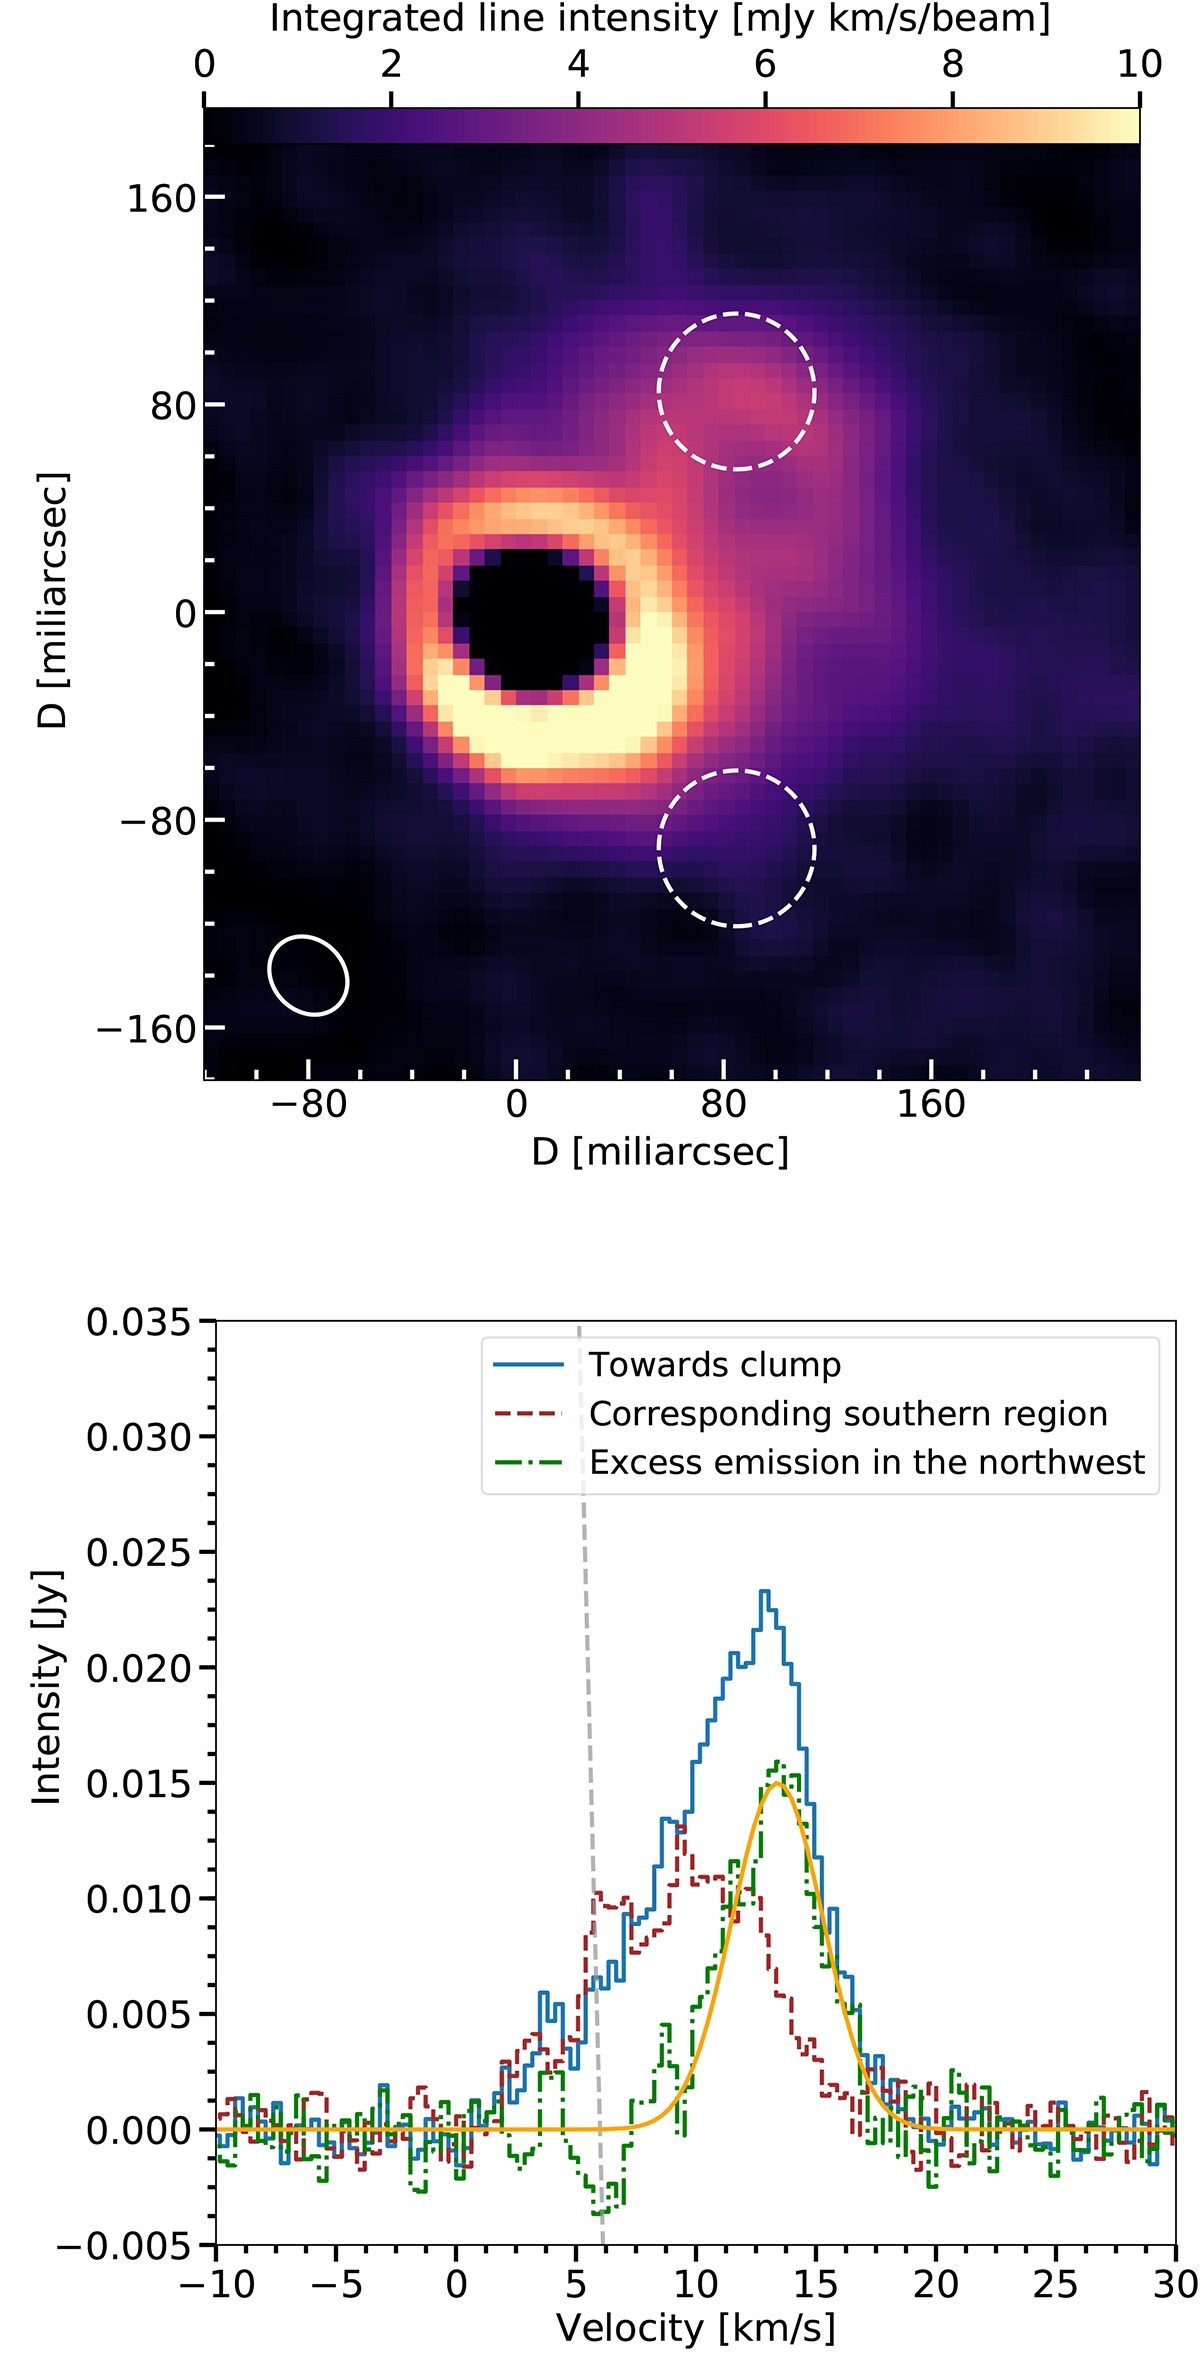
Observations of the inner clump. Upper panel: integrated line intensity (moment-zero) map of CO J = 2 − 1 emission integrated in velocity between 9 km s−1 and 19 km s−1. The dashed white circles shows the region from which we extracted spectra to characterise the blob (circle on the northern hemisphere) and the region for the reference spectrum (circle on the southern hemisphere). The white ellipse shows the half-power size of the ALMA beam. Lower panel: spectrum towards the inner blob (solid blue line) and a corresponding region in the southern hemisphere (dashed brown line). The dash-dotted green line shows the difference between these two spectra, the solid yellow gaussian shows the fit to the excess emission in the north-west. The gaussian function has an amplitude of 15 mJy, a standard deviation of 1.9 km s−1 and is centred at 13.4 km s−1. For reference, the vertical dashed grey line indicates one of the values for the systemic velocity derived by us (7.4 km s−1).
Current usage metrics show cumulative count of Article Views (full-text article views including HTML views, PDF and ePub downloads, according to the available data) and Abstracts Views on Vision4Press platform.
Data correspond to usage on the plateform after 2015. The current usage metrics is available 48-96 hours after online publication and is updated daily on week days.
Initial download of the metrics may take a while.