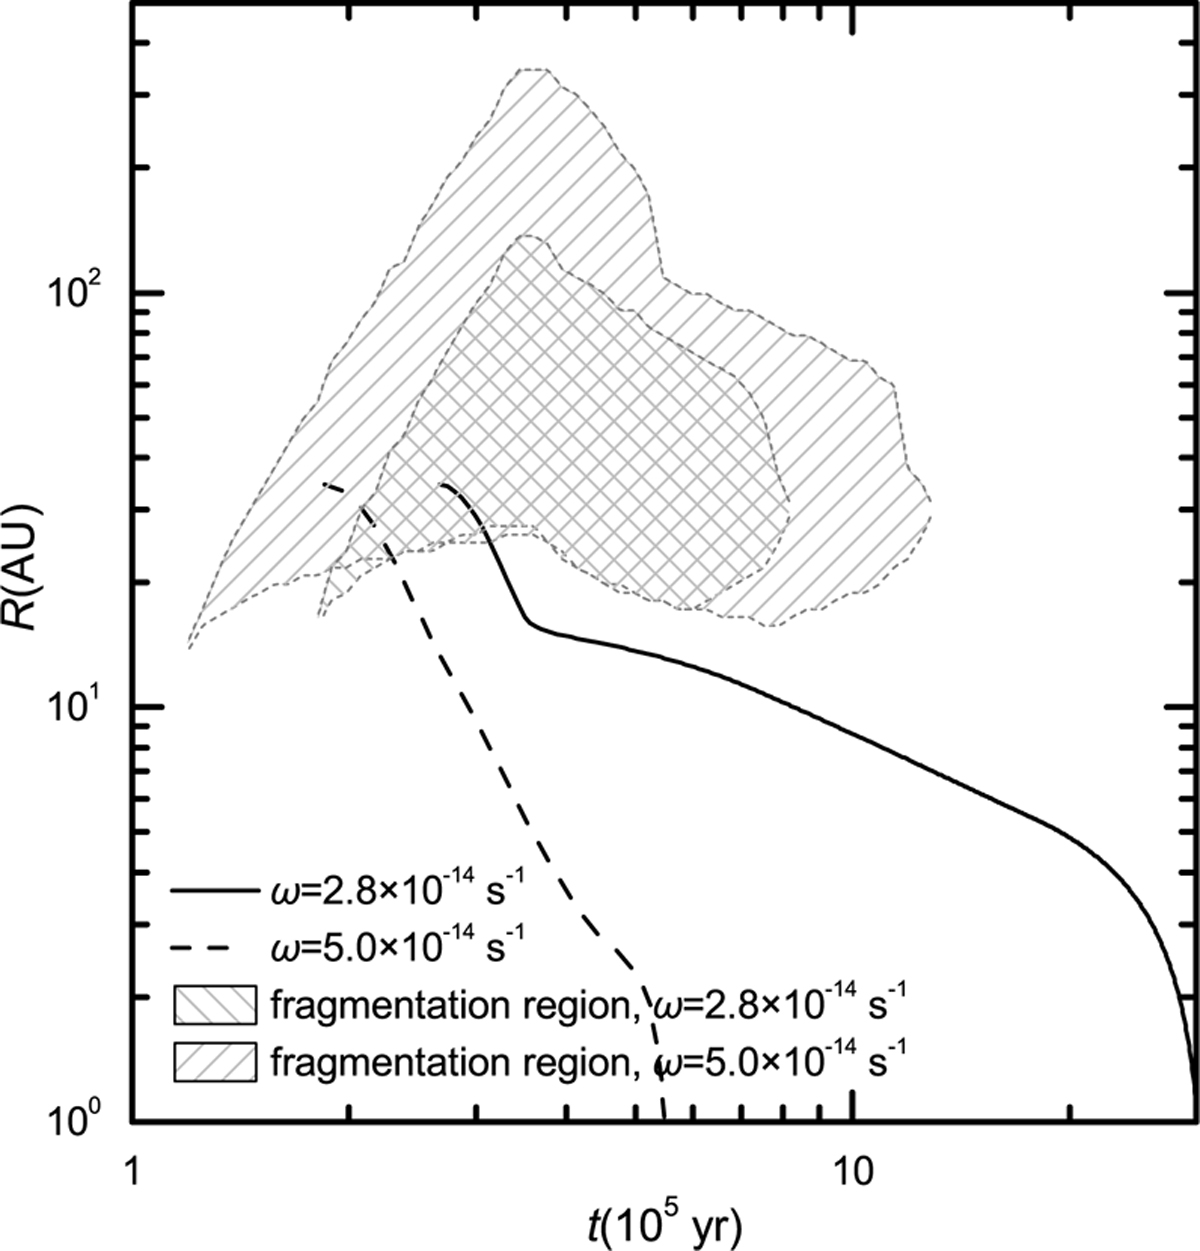
Fig. 8
Download original image
Effect of the early formation of the clump with different ω. This figure shows the time evolution of the radial positions of clumps forming at the same radius Rinit = 34 AU in different disks with different ω and the same MMCC = 1 M⊙ and TMCC = 15 K. The solid line represents the evolution of the radial position of a clump forming at i = 2.7 × 10⁵ yr in a disk with ω = 2.8 × 10⁻¹⁴ s−1 and the dashed line represents that of a clump forming at i = 1.8 × 10⁵ yr in a disk with ω = 5.0 × 10⁻¹⁴ s−1. The shaded regions indicate the fragmentation regions, which refer to when and where the fragmentation conditions are satisfied.
Current usage metrics show cumulative count of Article Views (full-text article views including HTML views, PDF and ePub downloads, according to the available data) and Abstracts Views on Vision4Press platform.
Data correspond to usage on the plateform after 2015. The current usage metrics is available 48-96 hours after online publication and is updated daily on week days.
Initial download of the metrics may take a while.