Fig. 7
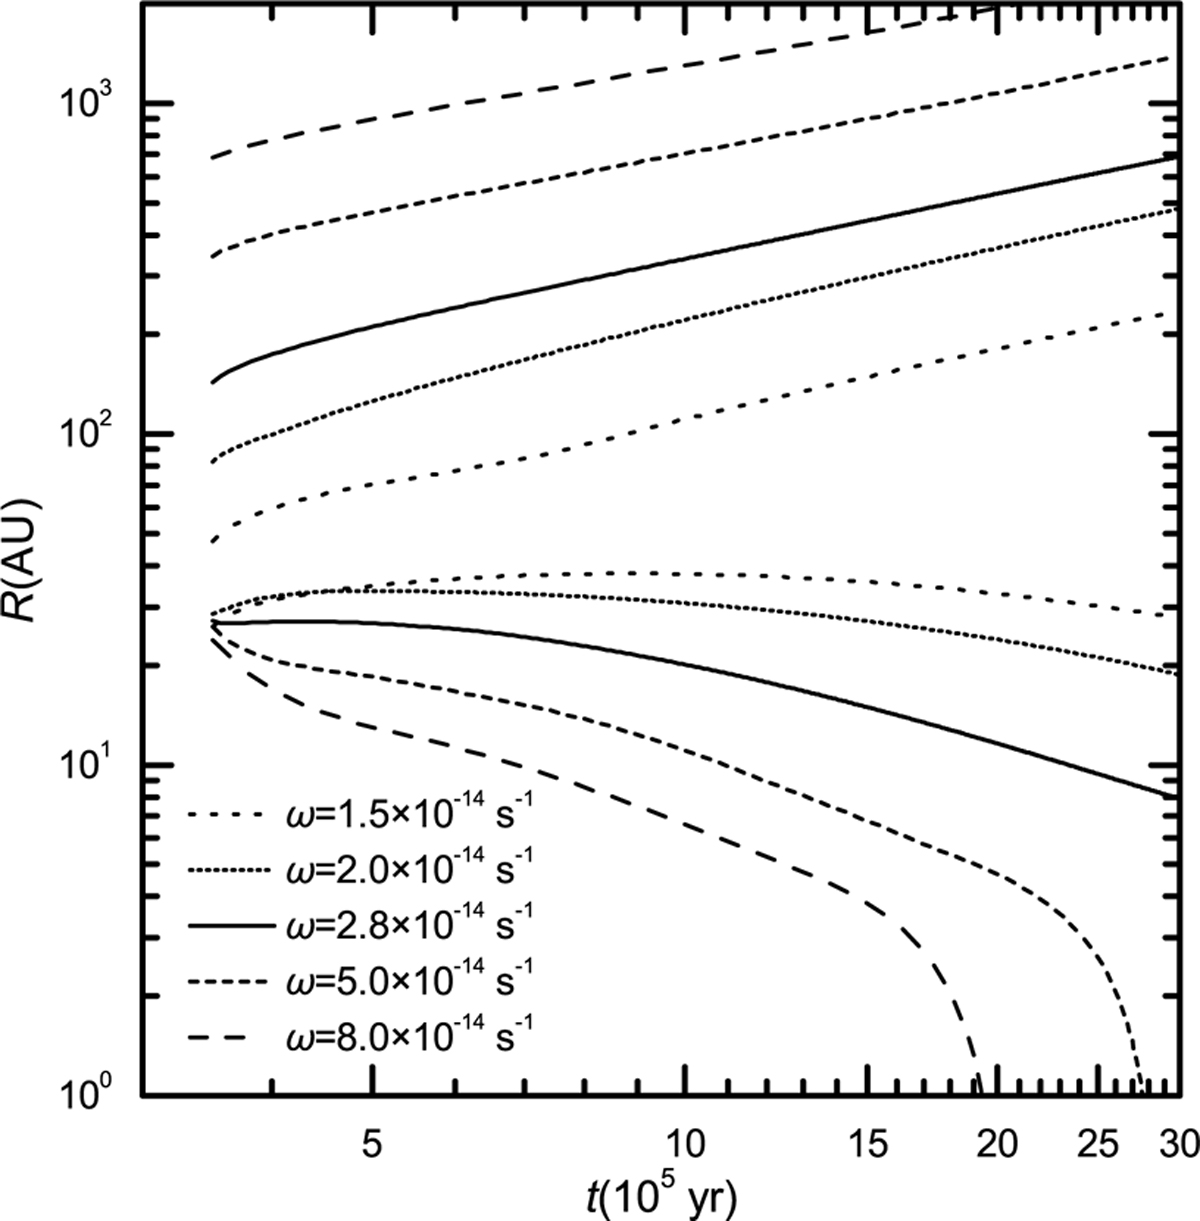
Download original image
Dependence of clump migration on ω in disks with MMCC = 1 M⊙ and TMCC = 15 K. Using different line styles, we differentiate different ω values. Each pair of the lines with the same style represents the time evolution of the radial positions of the clumps forming at the inner and the outer boundary of the fragmentation region at t = 3.5 × 10⁵ yr (time when the collapse of the parent cloud core ends) in a protoplanetary disk with a specific ω. The pairs of the dotted, short-dotted, solid, short-dashed, and dashed lines represent the evolution of the radial positions of clumps forming in disks with ω = 1.5 × 10⁻¹⁴ s−1, 2.0 × 10⁻¹⁴ s−1 2.8 × 10⁻¹⁴ s−1 5.0 × 10⁻¹⁴ s−1 and 8.0 × 10⁻¹⁴ s−1 respectively. The other information is the same as Fig. 1.
Current usage metrics show cumulative count of Article Views (full-text article views including HTML views, PDF and ePub downloads, according to the available data) and Abstracts Views on Vision4Press platform.
Data correspond to usage on the plateform after 2015. The current usage metrics is available 48-96 hours after online publication and is updated daily on week days.
Initial download of the metrics may take a while.