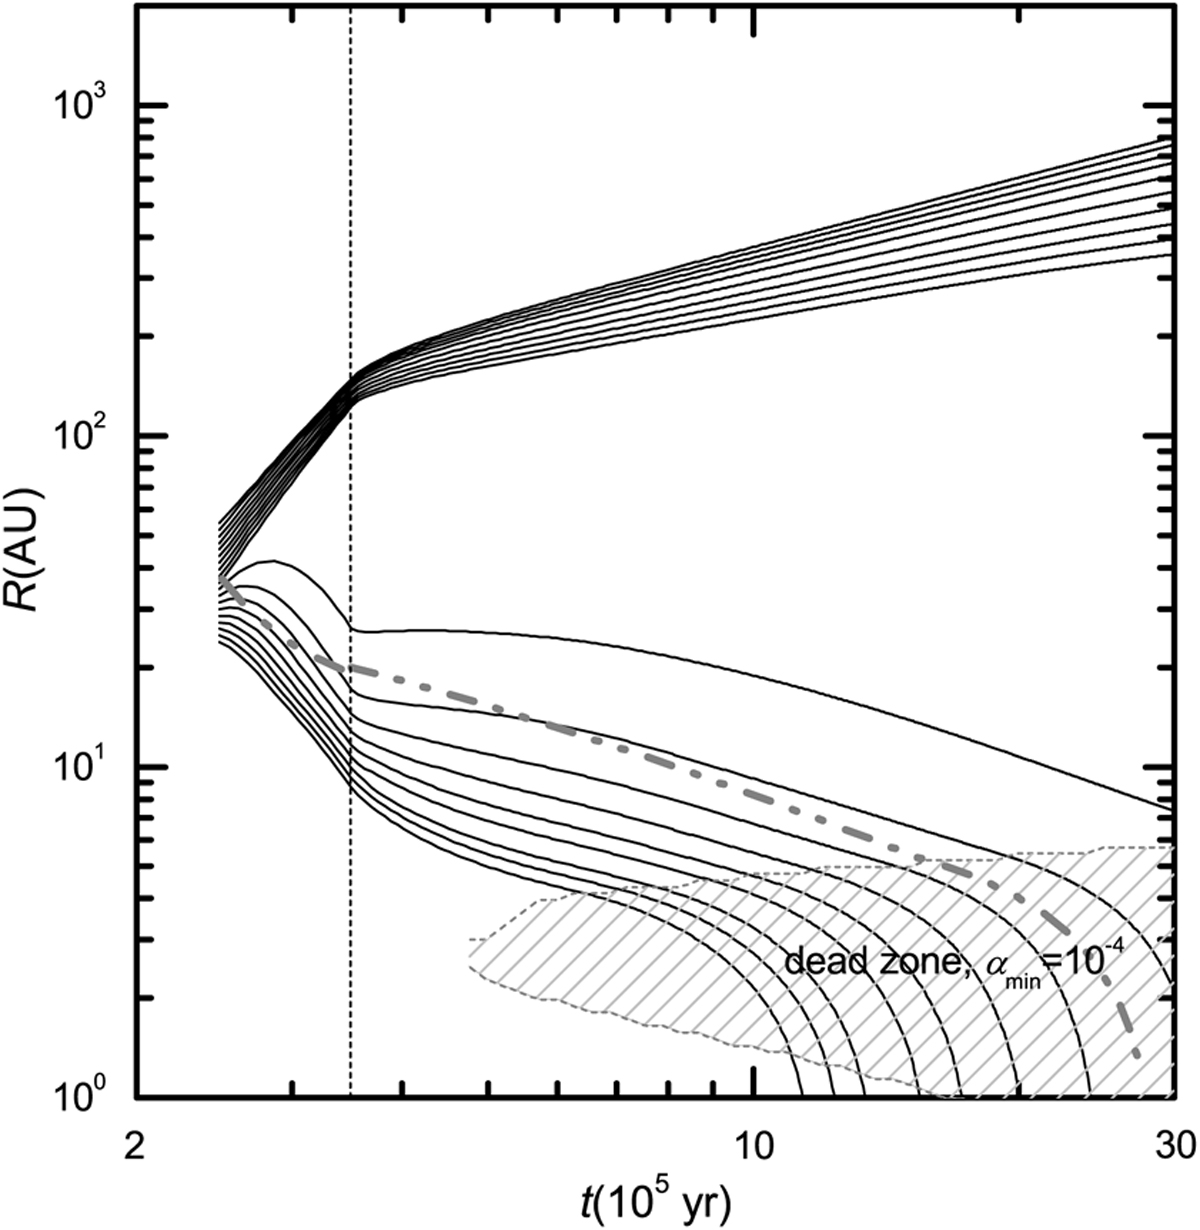
Fig. 2
Download original image
Same as Fig. 1, except that clumps form at a different time, t = 2.5 × 10⁵ yr. The solid lines from the top to the bottom represent the evolution of the radial positions of clumps forming at Rinit = 55 AU, 52 AU, 50 AU, 48 AU, 45 AU, 43 AU, 41 AU, 40 AU, 38 AU, 36 AU, 34 AU, 33 AU, 31 AU, 30 AU, 29 AU, 27 AU, 26 AU, 25 AU, and 24 AU, respectively. The dash-dot-dotted line represents the semi-analytical estimate from Appendix A for the evolution of the radial positions of a clump forming at 37 AU.
Current usage metrics show cumulative count of Article Views (full-text article views including HTML views, PDF and ePub downloads, according to the available data) and Abstracts Views on Vision4Press platform.
Data correspond to usage on the plateform after 2015. The current usage metrics is available 48-96 hours after online publication and is updated daily on week days.
Initial download of the metrics may take a while.