Fig. 1
Download original image
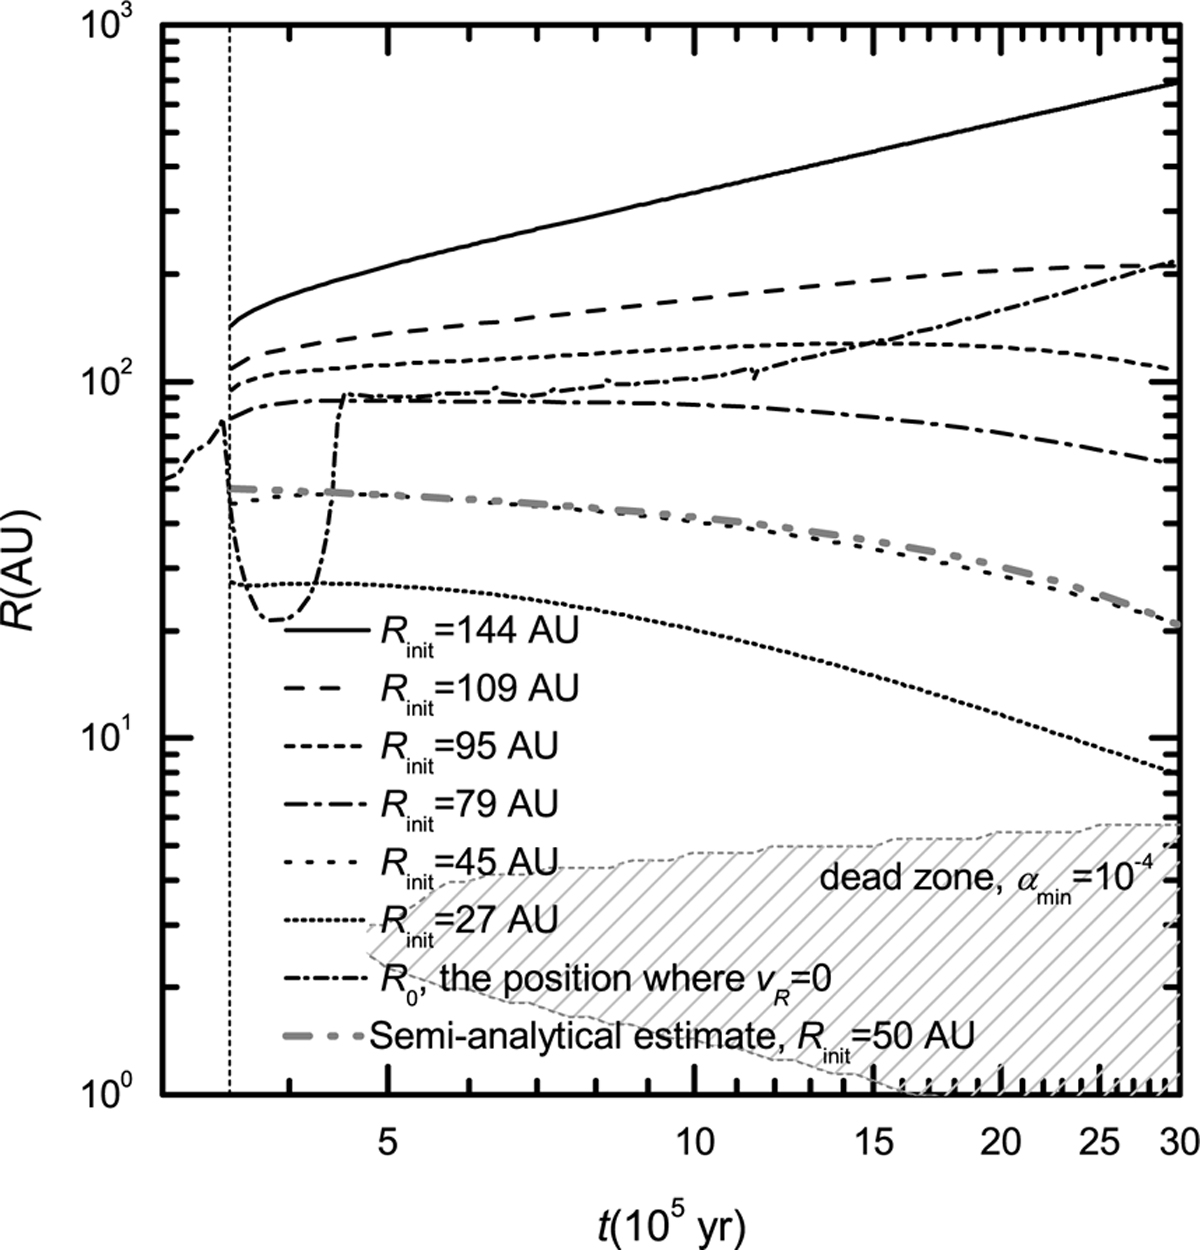
Time evolution of the radial positions of clumps forming at different radii at t = 3.5 × 10⁵ yr in a protoplanetary disk with MMCC = 1 M⊙, TMCC = 15 K, and ω = 2.8 × 10⁻¹⁴ s−1. The adopted αmin is 10−4. Each line represents the time evolution of the radial position of a clump forming at a specific radius, Rinit. The solid, dashed, short-dashed, dash-dotted, dotted, and short-dotted lines represent the evolution of the radial positions for clumps forming at Rinit = 144 AU, 109 AU, 95 AU, 79 AU, 45 AU, and 27 AU, respectively. The dash-dot-dotted line represents the semi-analytical estimate from Appendix A for the evolution of the radial positions of a clump forming at 50 AU. The short-dash-dotted line represents the evolution of R0, the radial position where υR = 0. The shaded region shows the dead zone. The time t = 0 is set to be the beginning of the collapse of the parent cloud core. The vertical line indicates tinfall, the time when the collapse ends. We chose Rinit to be in the fragmentation region where the fragmentation conditions are satisfied.
Current usage metrics show cumulative count of Article Views (full-text article views including HTML views, PDF and ePub downloads, according to the available data) and Abstracts Views on Vision4Press platform.
Data correspond to usage on the plateform after 2015. The current usage metrics is available 48-96 hours after online publication and is updated daily on week days.
Initial download of the metrics may take a while.