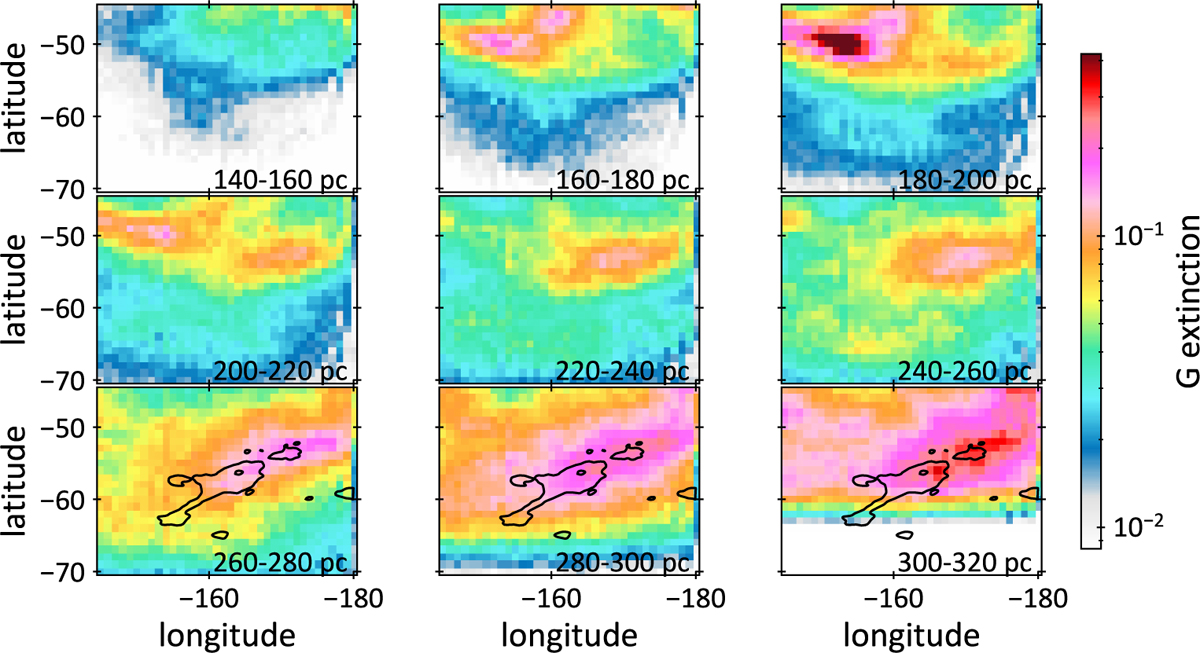
Fig. A.3

Download original image
Maps of the G-band extinction optical depth integrated over 20 pc-wide intervals in distance from the Sun, towards the Orion-Eridanus region. The data come from the 3D distribution of Leike et al. (2020). The dust cloud that spans the region nearly horizontally around b = 50º and at distances between 160 and 260 pc marks the rim of the Orion-Eridanus superbubble. At larger distances, the black contours delineate the Eridu HI cloud as in Fig. 1. The distance ranges are labelled in each map.
Current usage metrics show cumulative count of Article Views (full-text article views including HTML views, PDF and ePub downloads, according to the available data) and Abstracts Views on Vision4Press platform.
Data correspond to usage on the plateform after 2015. The current usage metrics is available 48-96 hours after online publication and is updated daily on week days.
Initial download of the metrics may take a while.


