Fig. 15

Download original image
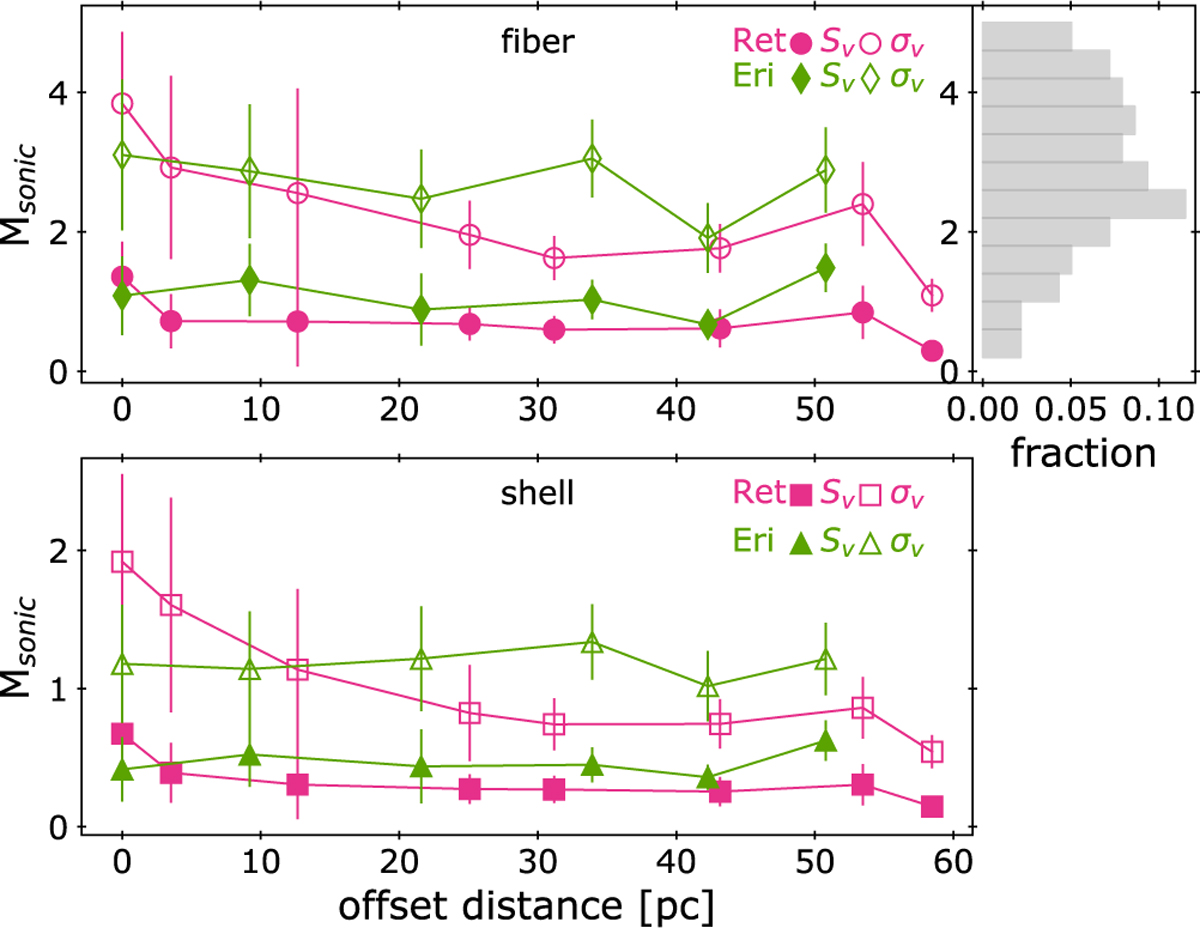
Sonic Mach numbers of turbulent motions in the 1°-wide squares chosen along the Eridu (green) and Reticulum (magenta) filaments, in the fibre (top) and shell (bottom) geometries, assuming isotropic turbulence and using the Sv dispersion function (dark filled symbols) or the σv line width (light open symbols) to trace the one-dimensional turbulent velocity dispersion. The data points and error bars respectively give the mean value in each ~5 pc-wide square and the rms dispersion at 0.5–0.7 pc scale inside each square. The histogram shows the Mach number distribution in cold CNM clumps from Heiles & Troland (2003).
Current usage metrics show cumulative count of Article Views (full-text article views including HTML views, PDF and ePub downloads, according to the available data) and Abstracts Views on Vision4Press platform.
Data correspond to usage on the plateform after 2015. The current usage metrics is available 48-96 hours after online publication and is updated daily on week days.
Initial download of the metrics may take a while.


