Fig. 5
Download original image
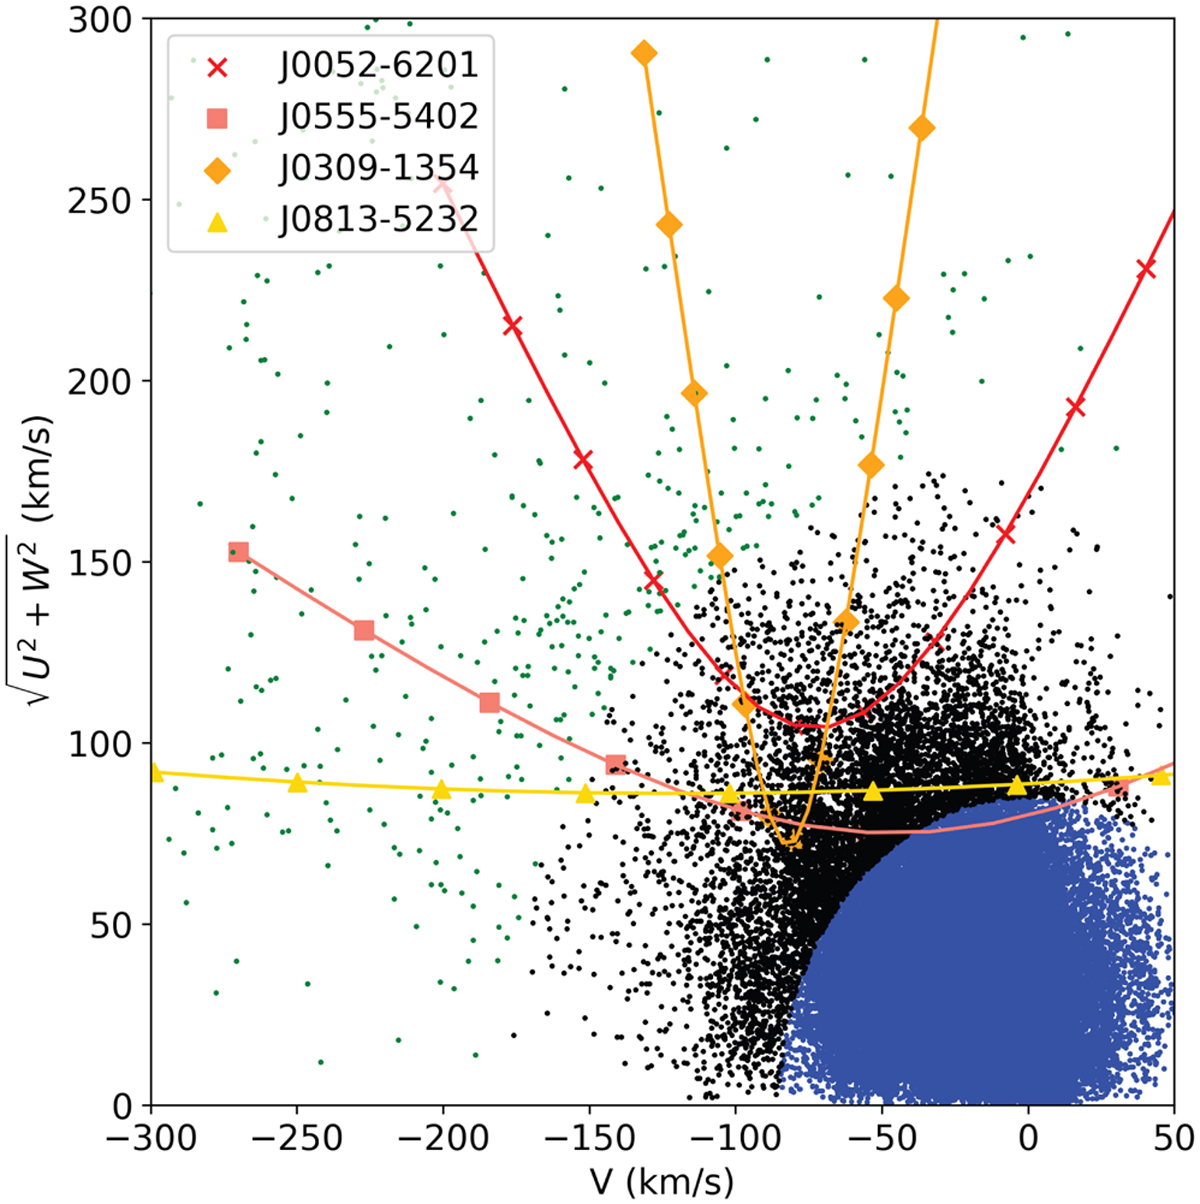
Position on Toomre diagram of the four potential subdwarfs (see text), assuming different radial velocities (in red: markers are spread out every 50 km s−1, varies from −300 to 300 km s−1). Background dots are sources from the Gaia Catalogue of Nearby Stars, with known radial velocities: halo stars are displayed in green, thick disk stars are in black, and thin disk stars are in blue.
Current usage metrics show cumulative count of Article Views (full-text article views including HTML views, PDF and ePub downloads, according to the available data) and Abstracts Views on Vision4Press platform.
Data correspond to usage on the plateform after 2015. The current usage metrics is available 48-96 hours after online publication and is updated daily on week days.
Initial download of the metrics may take a while.