Fig. 4
Download original image
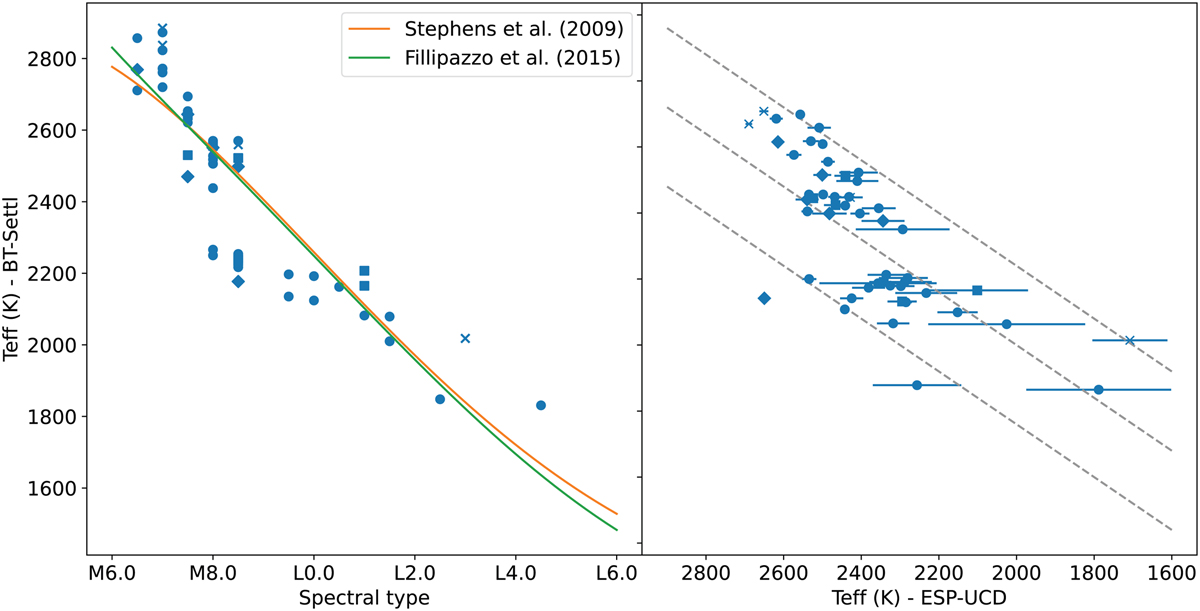
Comparison between the temperatures (blue) against the spectral types found in this work (left). The Stephens et al. (2009) and Filippazzo et al. (2015) spectral-type–Teff relations are also shown in orange and green. Comparison between the temperatures found in this work and those of the Gaia ESP-UCD pipeline (right). The identity line is plotted in grey as well as the identity line ±300 K. Symbols are the same as those used in Fig. 1.
Current usage metrics show cumulative count of Article Views (full-text article views including HTML views, PDF and ePub downloads, according to the available data) and Abstracts Views on Vision4Press platform.
Data correspond to usage on the plateform after 2015. The current usage metrics is available 48-96 hours after online publication and is updated daily on week days.
Initial download of the metrics may take a while.