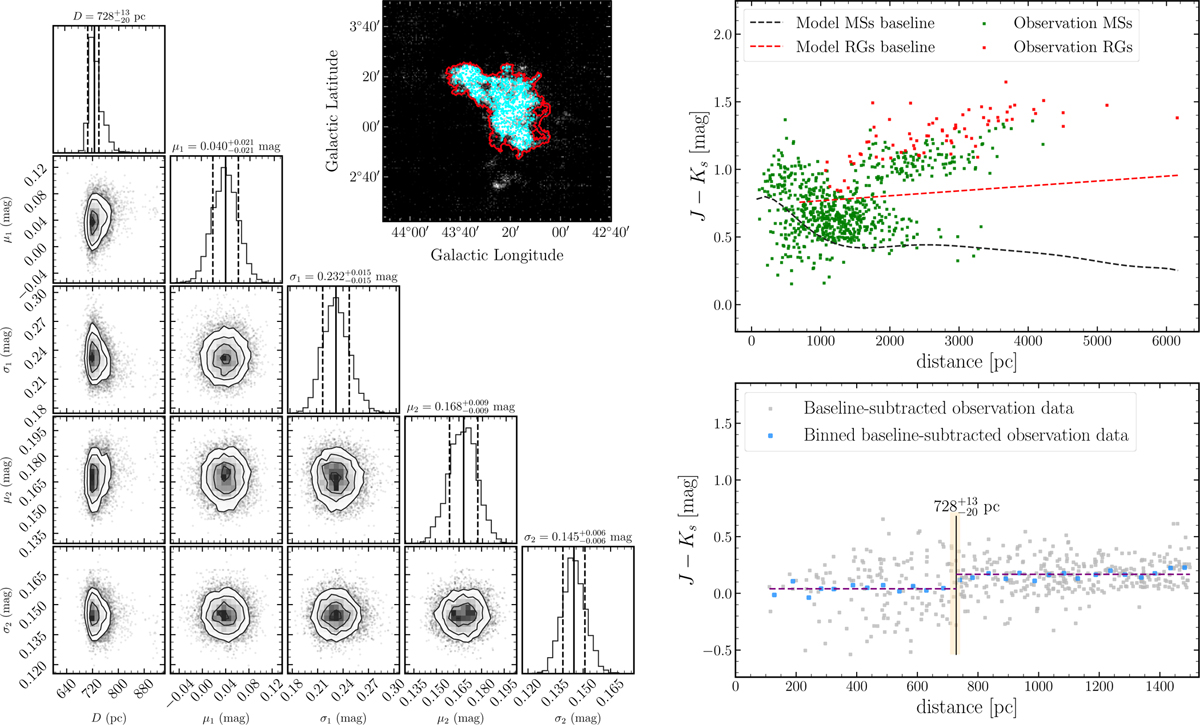
Fig. 9
Download original image
Distance of G043.3+03.1. The red contours refer to the molecular cloud footprint, and the cyan points represent the on-cloud stars. The left and bottom right panels are corner maps and estimate the distance of the MCMC sampling (see Fig. 8 for details). The red and green points in the top right panel present RGs and MSs that were distinguished in the observation data, respectively. The dashed black and red lines show the model-fitted RGs and MSs baseline, respectively.
Current usage metrics show cumulative count of Article Views (full-text article views including HTML views, PDF and ePub downloads, according to the available data) and Abstracts Views on Vision4Press platform.
Data correspond to usage on the plateform after 2015. The current usage metrics is available 48-96 hours after online publication and is updated daily on week days.
Initial download of the metrics may take a while.