Fig. 8
Download original image
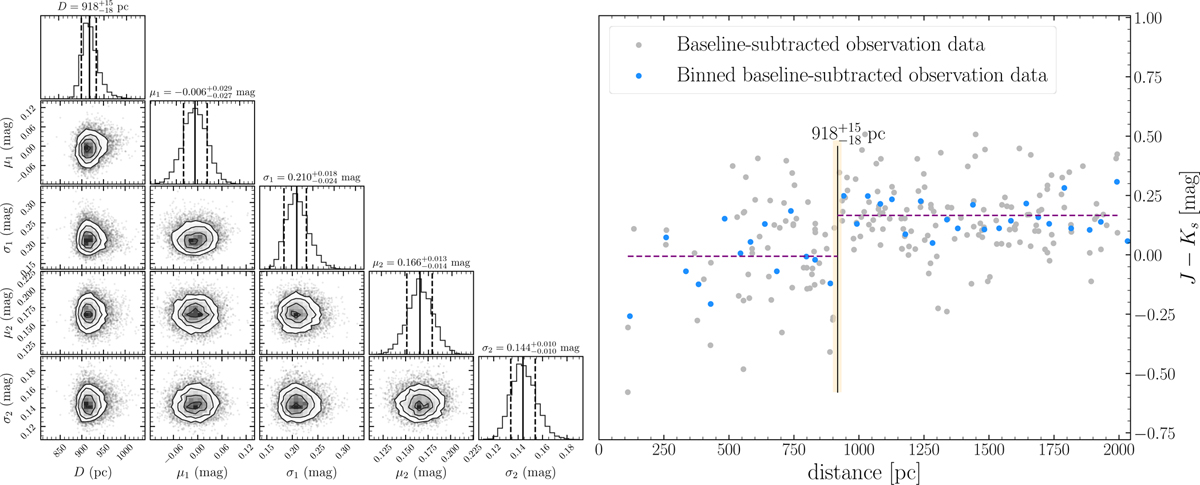
Distances of GO45.1-03.4. The corner plots of the MCMC samples of five modeled parameters and their uncertainties are displayed on the left. The right panel displays the distance result. The vertical black lines indicate the estimated distance (D), and the shadow areas depict the 16th and 84th percentile values of the cloud distance. The broken horizontal dashed purple line is the color variation of the on-cloud stars after the baseline was subtracted.
Current usage metrics show cumulative count of Article Views (full-text article views including HTML views, PDF and ePub downloads, according to the available data) and Abstracts Views on Vision4Press platform.
Data correspond to usage on the plateform after 2015. The current usage metrics is available 48-96 hours after online publication and is updated daily on week days.
Initial download of the metrics may take a while.