Open Access
Fig. 7
Download original image
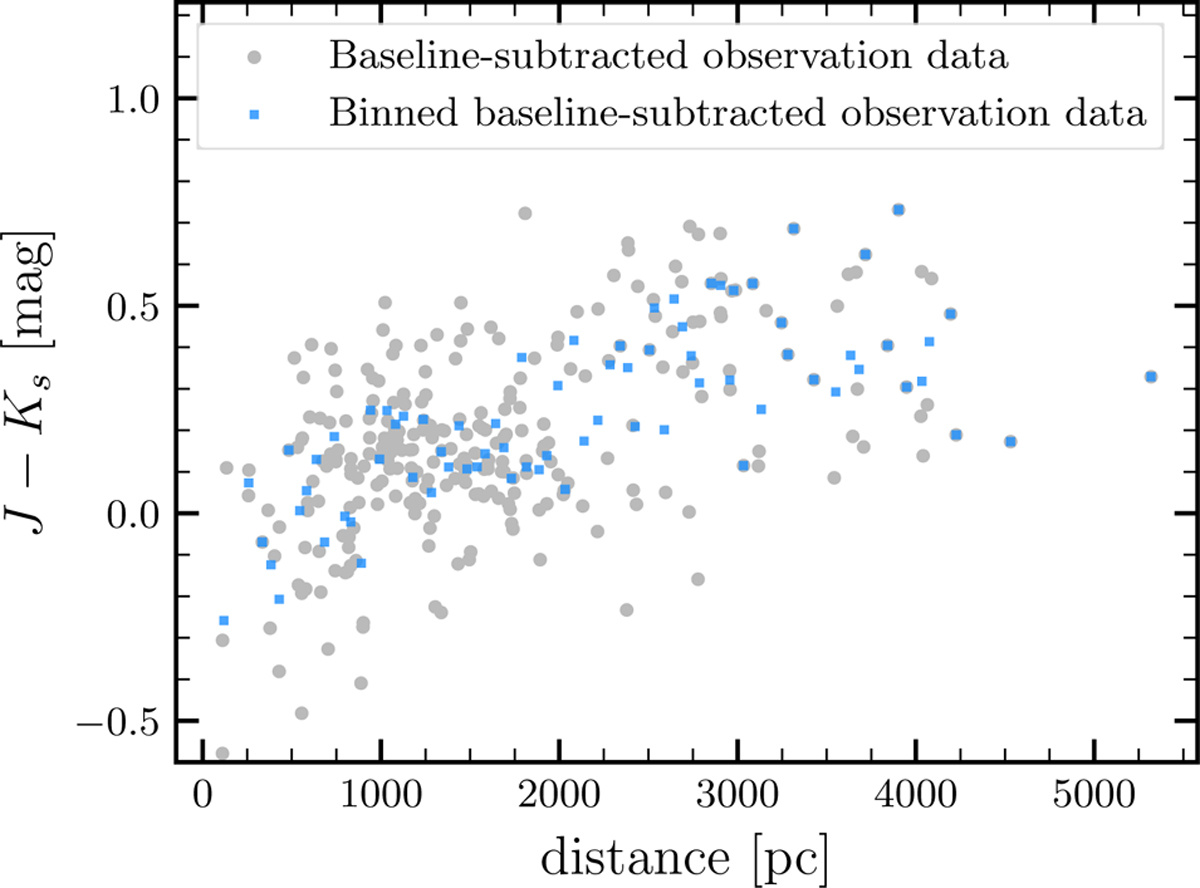
Distribution of the observation data after the color is calibrated. The gray points present the baseline-subtracted observation data. The blue points plot the mean color of the binned stars (every 50 pc for the distance), which are only used to confirm the results for inspection by eye and not to calculate the distance.
Current usage metrics show cumulative count of Article Views (full-text article views including HTML views, PDF and ePub downloads, according to the available data) and Abstracts Views on Vision4Press platform.
Data correspond to usage on the plateform after 2015. The current usage metrics is available 48-96 hours after online publication and is updated daily on week days.
Initial download of the metrics may take a while.