Fig. 6
Download original image
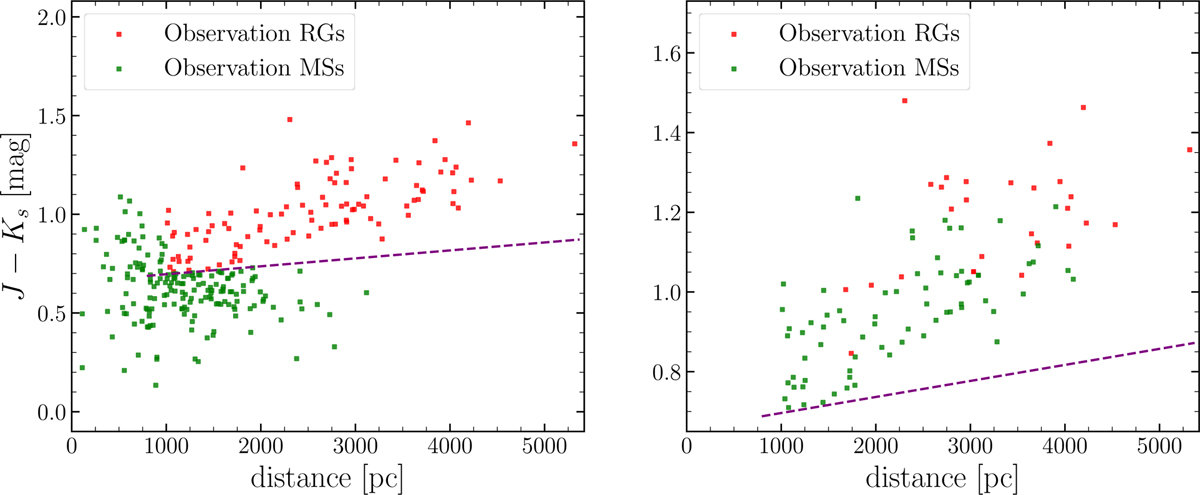
Left panel: distinguished MSs and RGs in the observation data using the 3σ lower bound line of the model-fit RGs baseline (dashed purple line) and a distance of 1 kpc. Right panel: further distinction between the RGs and reddened stars for the differentiated RGs, and reddened stars are classified as MSs. The green and red points show the MSs and RGs of the observation data, respectively.
Current usage metrics show cumulative count of Article Views (full-text article views including HTML views, PDF and ePub downloads, according to the available data) and Abstracts Views on Vision4Press platform.
Data correspond to usage on the plateform after 2015. The current usage metrics is available 48-96 hours after online publication and is updated daily on week days.
Initial download of the metrics may take a while.