Open Access
Fig. 5
Download original image
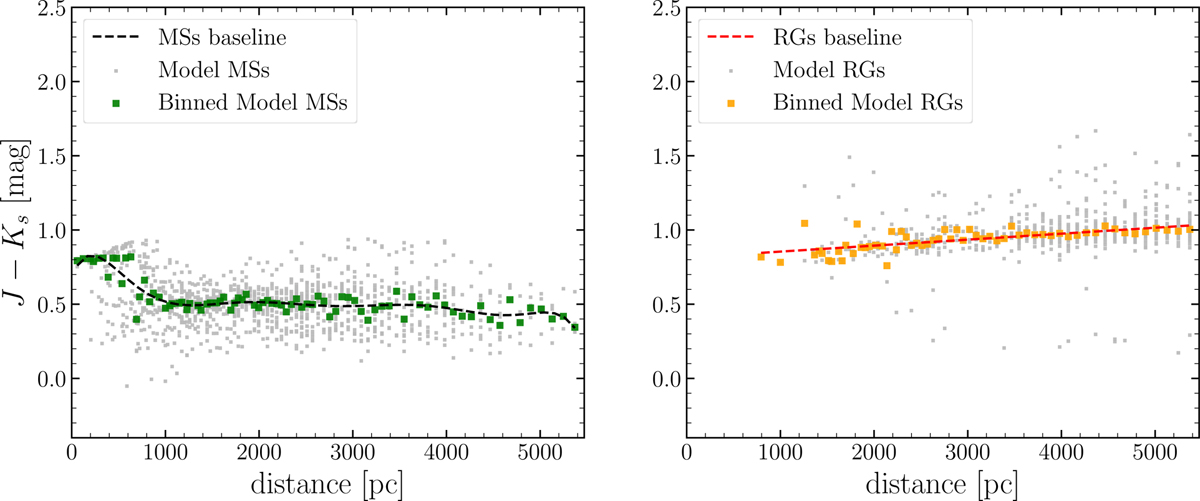
Left and right panels: fit baselines for MSs (dashed black line) and for RGs (dashed red line) in the model data, respectively. The gray squares present the model data. The green and orange squares present the binned MSs and RGs stars (every 50 pc), respectively.
Current usage metrics show cumulative count of Article Views (full-text article views including HTML views, PDF and ePub downloads, according to the available data) and Abstracts Views on Vision4Press platform.
Data correspond to usage on the plateform after 2015. The current usage metrics is available 48-96 hours after online publication and is updated daily on week days.
Initial download of the metrics may take a while.